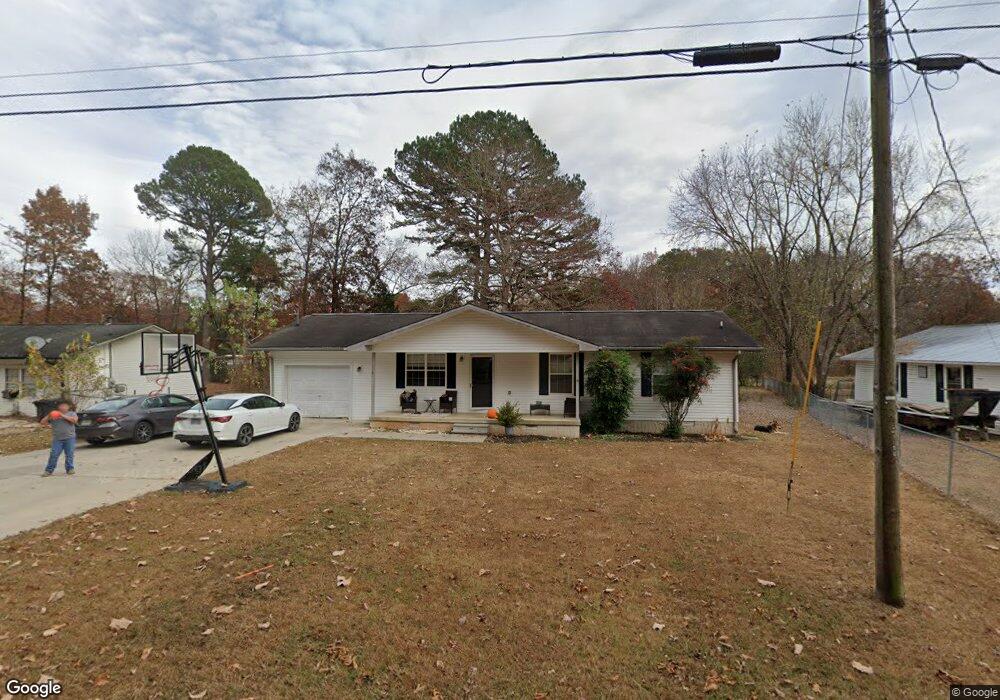
116 Savage Rd Dunlap, TN 37327
Estimated Value: $205,241 - $288,000
Studio
2
Baths
1,144
Sq Ft
$204/Sq Ft
Est. Value
About This Home
This home is located at 116 Savage Rd, Dunlap, TN 37327 and is currently estimated at $233,560, approximately $204 per square foot. 116 Savage Rd is a home located in Sequatchie County with nearby schools including Griffith Elementary School, Sequatchie County Middle School, and Sequatchie County High School.
Ownership History
Date
Name
Owned For
Owner Type
Purchase Details
Closed on
Oct 16, 2017
Sold by
Standefer Nelson A and Standefer Peggy
Bought by
Beene Michael and Beene Miranda
Current Estimated Value
Home Financials for this Owner
Home Financials are based on the most recent Mortgage that was taken out on this home.
Original Mortgage
$108,007
Outstanding Balance
$93,078
Interest Rate
5.25%
Mortgage Type
FHA
Estimated Equity
$140,482
Purchase Details
Closed on
Nov 18, 2005
Sold by
Misty Harmon
Bought by
Standefer Nelson A
Purchase Details
Closed on
Nov 18, 2003
Sold by
Lewis Johnny E and Lewis Loren M
Bought by
Dennis Harmon and Dennis Misty
Home Financials for this Owner
Home Financials are based on the most recent Mortgage that was taken out on this home.
Original Mortgage
$68,000
Interest Rate
9.4%
Purchase Details
Closed on
Sep 4, 1996
Bought by
Weaver Stephen R and Wife Patricia A
Create a Home Valuation Report for This Property
The Home Valuation Report is an in-depth analysis detailing your home's value as well as a comparison with similar homes in the area
Home Values in the Area
Average Home Value in this Area
Purchase History
| Date | Buyer | Sale Price | Title Company |
|---|---|---|---|
| Beene Michael | $110,000 | None Available | |
| Standefer Nelson A | $78,500 | -- | |
| Dennis Harmon | $65,500 | -- | |
| Weaver Stephen R | $45,000 | -- |
Source: Public Records
Mortgage History
| Date | Status | Borrower | Loan Amount |
|---|---|---|---|
| Open | Beene Michael | $108,007 | |
| Previous Owner | Weaver Stephen R | $68,000 |
Source: Public Records
Tax History
| Year | Tax Paid | Tax Assessment Tax Assessment Total Assessment is a certain percentage of the fair market value that is determined by local assessors to be the total taxable value of land and additions on the property. | Land | Improvement |
|---|---|---|---|---|
| 2025 | -- | $44,600 | $3,175 | $41,425 |
| 2024 | $1,077 | $44,600 | $3,175 | $41,425 |
| 2023 | $1,077 | $44,600 | $3,175 | $41,425 |
| 2022 | $883 | $26,625 | $2,000 | $24,625 |
| 2021 | $870 | $26,625 | $2,000 | $24,625 |
| 2020 | $870 | $26,625 | $2,000 | $24,625 |
| 2019 | $870 | $26,625 | $2,000 | $24,625 |
| 2018 | $860 | $26,625 | $2,000 | $24,625 |
| 2017 | $706 | $22,125 | $2,000 | $20,125 |
| 2016 | $720 | $21,600 | $2,250 | $19,350 |
| 2015 | $719 | $21,600 | $2,250 | $19,350 |
| 2014 | $719 | $21,600 | $2,250 | $19,350 |
Source: Public Records
Map
Nearby Homes
- 116 Maple St
- 1038 Sawmill Creek Rd
- 563 Old Union Rd
- 481 Tram Trail
- 18298 Rankin Ave
- 79 Bear Oak Dr
- 249 Bear Oak Dr
- 157 Bear Oak Dr
- 217 A Day Dream Dr
- 267 Williams Rd
- 496 Boyd Rd
- 1086 River Ridge Dr
- 1086 River Ridge Dr Unit Lot 58
- 87 Happy Valley Rd
- 1473 Old York Hwy N
- 453 Hill Cir
- 0 Fredonia Loop
- 12 Fredonia Rd
- 11342 Fredonia Rd
- 07 Fredonia Rd
- 116 Old Savage Rd
- 116 Savage Rd
- 130 Savage Rd
- 0 Maple St Unit 1116433
- 0 Maple St Unit 1053016
- 95 Savage Rd
- 42 Water St
- 82 Savage Rd
- 448 Savage Rd
- 95 Savage Rd
- 176 Savage Rd
- 58 Water St
- 198 Savage Rd
- 61 Savage Rd
- 427 Savage Rd
- 218 Savage Rd
- 149 Savage Rd
- 175 Savage Rd
- 189 Savage Rd
- 189 Savage Rd Unit 1
Your Personal Tour Guide
Ask me questions while you tour the home.