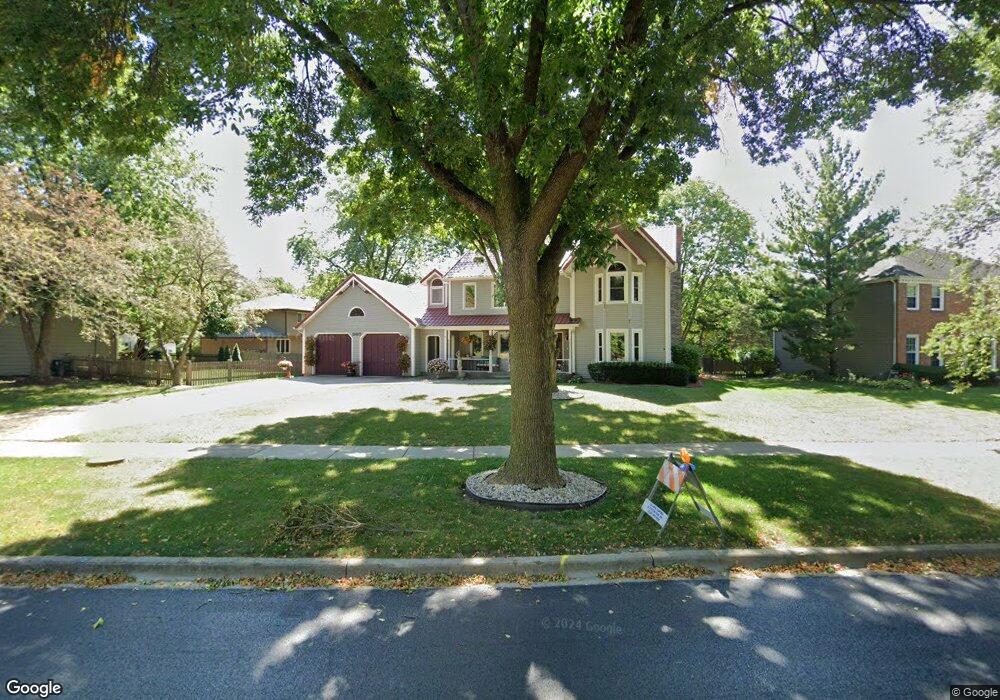
1160 Sequoia Rd Naperville, IL 60540
Watts NeighborhoodEstimated Value: $744,000 - $827,302
5
Beds
3
Baths
3,285
Sq Ft
$239/Sq Ft
Est. Value
About This Home
This home is located at 1160 Sequoia Rd, Naperville, IL 60540 and is currently estimated at $785,826, approximately $239 per square foot. 1160 Sequoia Rd is a home located in DuPage County with nearby schools including May Watts Elementary School, Thayer J. Hill Middle School, and Metea Valley High School.
Ownership History
Date
Name
Owned For
Owner Type
Purchase Details
Closed on
Sep 6, 2017
Sold by
Hakim Philip C and Philip C Hakim Trust
Bought by
Hakim Philip C and Hakim Kimberly S
Current Estimated Value
Purchase Details
Closed on
Jul 13, 2009
Sold by
Hakim Philip C and Hakim Kimberly S
Bought by
Philip C Hakim Trust
Purchase Details
Closed on
Mar 6, 1999
Sold by
Wakley James L and Wakley Linda C
Bought by
Hakim Philip and Hakim Kimberly
Create a Home Valuation Report for This Property
The Home Valuation Report is an in-depth analysis detailing your home's value as well as a comparison with similar homes in the area
Home Values in the Area
Average Home Value in this Area
Purchase History
| Date | Buyer | Sale Price | Title Company |
|---|---|---|---|
| Hakim Philip C | -- | Attorney | |
| Philip C Hakim Trust | -- | None Available | |
| Hakim Philip | $313,500 | First American Title |
Source: Public Records
Tax History
| Year | Tax Paid | Tax Assessment Tax Assessment Total Assessment is a certain percentage of the fair market value that is determined by local assessors to be the total taxable value of land and additions on the property. | Land | Improvement |
|---|---|---|---|---|
| 2024 | $14,598 | $241,878 | $50,270 | $191,608 |
| 2023 | $13,997 | $217,340 | $45,170 | $172,170 |
| 2022 | $13,706 | $206,550 | $42,560 | $163,990 |
| 2021 | $13,279 | $199,180 | $41,040 | $158,140 |
| 2020 | $13,260 | $199,180 | $41,040 | $158,140 |
| 2019 | $12,745 | $189,440 | $39,030 | $150,410 |
| 2018 | $12,359 | $180,600 | $36,890 | $143,710 |
| 2017 | $12,024 | $174,480 | $35,640 | $138,840 |
| 2016 | $11,810 | $167,440 | $34,200 | $133,240 |
| 2015 | $11,706 | $158,980 | $32,470 | $126,510 |
| 2014 | $11,493 | $150,990 | $30,570 | $120,420 |
| 2013 | $11,467 | $152,040 | $30,780 | $121,260 |
Source: Public Records
Map
Nearby Homes
- 1161 Banyon Ct
- 816 S River Rd
- 731 S River Rd
- 7S410 Arbor Dr
- 854 Raintree Dr
- 1210 Lawnmeadow Ln
- 1095 Devonshire Ave
- 840 Mobile Ct
- 7S146 Wild Cherry Rd
- 611 Clover Ct
- 1524 Oswego Rd
- 615 Windridge Ct
- 417 River Bluff Cir
- 332 S River Rd
- 808 Shiloh Cir
- 511 Aurora Ave Unit 606
- 316 Hemlock Ln
- 1033 Emerald Dr
- 509 Aurora Ave Unit 616
- 845 Tulip Ln
- 1166 Sequoia Rd
- 759 Thornapple Dr
- 1154 Sequoia Rd
- 1155 Palmetto Ct
- 1159 Palmetto Ct
- 1172 Sequoia Rd
- 740 Clovetree Ct
- 763 Thornapple Dr
- 1157 Sequoia Rd
- 1163 Palmetto Ct
- 1178 Sequoia Rd
- 747 Thornapple Dr
- 1173 Sequoia Rd
- 760 Thornapple Dr
- 1146 Sequoia Rd
- 732 Clovetree Ct
- 764 Thornapple Dr
- 768 Thornapple Dr
- 743 Thornapple Dr
- 1177 Sequoia Rd
Your Personal Tour Guide
Ask me questions while you tour the home.