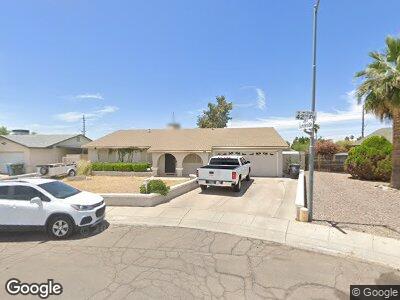
11628 N 42nd Dr Unit 7 Phoenix, AZ 85029
North Mountain Village NeighborhoodEstimated Value: $357,000 - $415,000
4
Beds
2
Baths
1,750
Sq Ft
$225/Sq Ft
Est. Value
About This Home
This home is located at 11628 N 42nd Dr Unit 7, Phoenix, AZ 85029 and is currently estimated at $394,439, approximately $225 per square foot. 11628 N 42nd Dr Unit 7 is a home located in Maricopa County with nearby schools including Tumbleweed Elementary School, Cholla Middle School, and Moon Valley High School.
Ownership History
Date
Name
Owned For
Owner Type
Purchase Details
Closed on
Sep 27, 2011
Sold by
Tineo Patricio L
Bought by
Tineo Patricio L and Sousa Marisela
Current Estimated Value
Home Financials for this Owner
Home Financials are based on the most recent Mortgage that was taken out on this home.
Original Mortgage
$105,749
Outstanding Balance
$73,687
Interest Rate
4.25%
Mortgage Type
FHA
Estimated Equity
$320,752
Purchase Details
Closed on
Sep 1, 2011
Sold by
Howard Dean Paul
Bought by
Tineo Patricio L
Home Financials for this Owner
Home Financials are based on the most recent Mortgage that was taken out on this home.
Original Mortgage
$105,749
Outstanding Balance
$73,687
Interest Rate
4.25%
Mortgage Type
FHA
Estimated Equity
$320,752
Purchase Details
Closed on
Oct 27, 1999
Sold by
Howard Mary Helen
Bought by
Howard Dean Paul
Create a Home Valuation Report for This Property
The Home Valuation Report is an in-depth analysis detailing your home's value as well as a comparison with similar homes in the area
Home Values in the Area
Average Home Value in this Area
Purchase History
| Date | Buyer | Sale Price | Title Company |
|---|---|---|---|
| Tineo Patricio L | -- | Accommodation | |
| Tineo Patricio L | $108,500 | American Title Service Agenc | |
| Howard Dean Paul | -- | -- |
Source: Public Records
Mortgage History
| Date | Status | Borrower | Loan Amount |
|---|---|---|---|
| Open | Tineo Patricio L | $8,981 | |
| Closed | Tineo Patricio L | $7,237 | |
| Closed | Tineo Patricio L | $6,030 | |
| Open | Tineo Patricio L | $105,749 | |
| Previous Owner | Howard Dean Paul | $183,000 | |
| Previous Owner | Howard Dean Paul | $10,001 | |
| Previous Owner | Howard Dean Paul | $40,000 | |
| Previous Owner | Howard Dean Paul | $16,500 | |
| Previous Owner | Howard Dean Paul | $131,900 | |
| Previous Owner | Howard Dean P | $97,600 | |
| Previous Owner | Howard Dean Paul | $10,000 |
Source: Public Records
Tax History Compared to Growth
Tax History
| Year | Tax Paid | Tax Assessment Tax Assessment Total Assessment is a certain percentage of the fair market value that is determined by local assessors to be the total taxable value of land and additions on the property. | Land | Improvement |
|---|---|---|---|---|
| 2025 | $1,284 | $11,985 | -- | -- |
| 2024 | $1,259 | $11,414 | -- | -- |
| 2023 | $1,259 | $28,780 | $5,750 | $23,030 |
| 2022 | $1,215 | $21,980 | $4,390 | $17,590 |
| 2021 | $1,245 | $20,370 | $4,070 | $16,300 |
| 2020 | $1,212 | $18,830 | $3,760 | $15,070 |
| 2019 | $1,190 | $16,980 | $3,390 | $13,590 |
| 2018 | $1,156 | $15,600 | $3,120 | $12,480 |
| 2017 | $1,153 | $13,330 | $2,660 | $10,670 |
| 2016 | $1,132 | $12,730 | $2,540 | $10,190 |
| 2015 | $1,050 | $12,120 | $2,420 | $9,700 |
Source: Public Records
Map
Nearby Homes
- 4207 W Poinsettia Dr
- 4153 W Sunnyside Ave
- 4233 W Paradise Dr Unit 5
- 4325 W Sierra St
- 4329 W Sierra St
- 4115 W Sierra St
- 12016 N 45th Ave
- 12208 N 41st Ln
- 12205 N 41st Ln
- 4549 W Poinsettia Dr
- 4530 W Paradise Dr
- 4330 W Mescal St
- 10833 N 43rd Dr
- 11621 N 39th Dr
- 4513 W Yucca St
- 4062 W Mescal St
- 11020 N 45th Ave
- 4626 W Altadena Ave
- 11025 N 45th Ln
- 4643 W Laurel Ln
- 11628 N 42nd Dr Unit 7
- 11622 N 42nd Dr
- 11632 N 42nd Dr
- 11616 N 42nd Dr
- 4220 W Sunnyside Dr
- 4219 W Sunnyside Dr
- 4233 W Poinsettia Dr
- 4227 W Poinsettia Dr
- 11615 N 42nd Dr Unit 7
- 11625 N 43rd Dr Unit 6
- 4214 W Sunnyside Dr
- 11610 N 42nd Dr
- 11631 N 43rd Dr
- 4213 W Sunnyside Dr
- 11619 N 43rd Dr
- 4221 W Poinsettia Dr
- 4213 W Sunnyside Ave
- 11613 N 43rd Dr
- 11609 N 42nd Dr
- 4301 W Poinsettia Dr