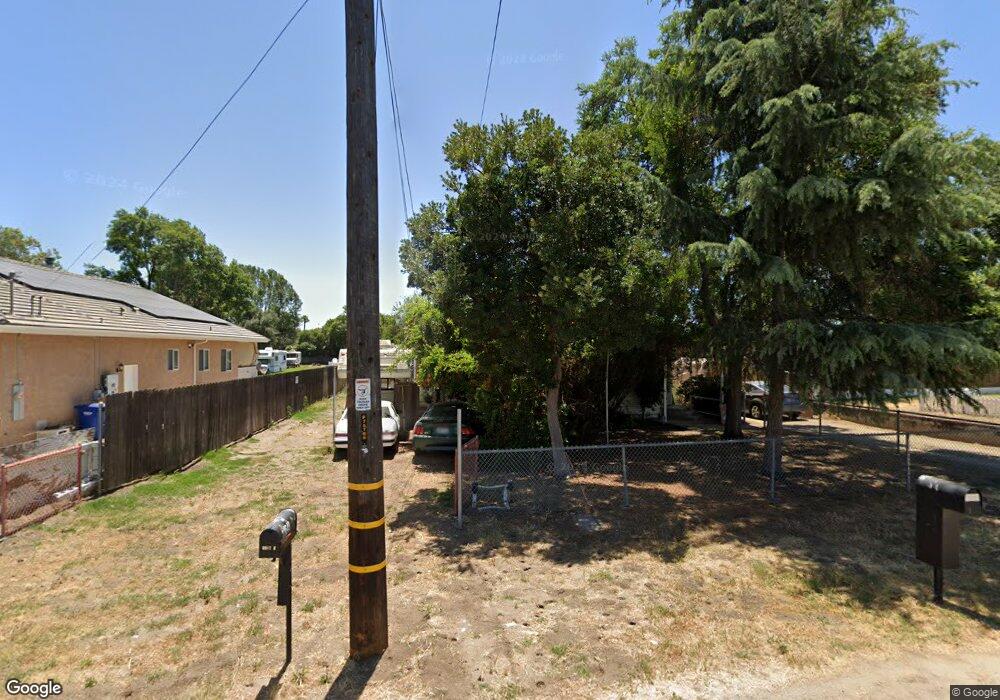
11649 Lakeside Ave Lakeside, CA 92040
Estimated Value: $646,000 - $709,276
3
Beds
1
Bath
934
Sq Ft
$727/Sq Ft
Est. Value
About This Home
This home is located at 11649 Lakeside Ave, Lakeside, CA 92040 and is currently estimated at $679,069, approximately $727 per square foot. 11649 Lakeside Ave is a home located in San Diego County with nearby schools including Lakeside Farms Elementary School, Lakeside Middle School, and El Capitan High School.
Ownership History
Date
Name
Owned For
Owner Type
Purchase Details
Closed on
Jan 7, 2002
Sold by
Arnold Mark and Arnold Becky E
Bought by
Arnold Mark
Current Estimated Value
Home Financials for this Owner
Home Financials are based on the most recent Mortgage that was taken out on this home.
Original Mortgage
$144,000
Outstanding Balance
$61,805
Interest Rate
7.75%
Mortgage Type
Stand Alone First
Estimated Equity
$617,264
Purchase Details
Closed on
Feb 26, 2000
Sold by
Arnold Beth Dyan
Bought by
Arnold Mark
Purchase Details
Closed on
Jun 22, 1995
Sold by
Barkow Harold W and Barkow Carolyn F
Bought by
Arnold Mark and Arnold Beth
Home Financials for this Owner
Home Financials are based on the most recent Mortgage that was taken out on this home.
Original Mortgage
$110,700
Interest Rate
7.71%
Purchase Details
Closed on
Sep 21, 1987
Create a Home Valuation Report for This Property
The Home Valuation Report is an in-depth analysis detailing your home's value as well as a comparison with similar homes in the area
Purchase History
| Date | Buyer | Sale Price | Title Company |
|---|---|---|---|
| Arnold Mark | -- | Old Republic Title Company | |
| Arnold Mark | -- | -- | |
| Arnold Mark | $123,000 | First American Title Co | |
| -- | $100,000 | -- |
Source: Public Records
Mortgage History
| Date | Status | Borrower | Loan Amount |
|---|---|---|---|
| Open | Arnold Mark | $144,000 | |
| Previous Owner | Arnold Mark | $110,700 |
Source: Public Records
Tax History
| Year | Tax Paid | Tax Assessment Tax Assessment Total Assessment is a certain percentage of the fair market value that is determined by local assessors to be the total taxable value of land and additions on the property. | Land | Improvement |
|---|---|---|---|---|
| 2025 | $2,625 | $218,753 | $99,659 | $119,094 |
| 2024 | $2,625 | $214,464 | $97,705 | $116,759 |
| 2023 | $2,531 | $210,260 | $95,790 | $114,470 |
| 2022 | $2,489 | $206,138 | $93,912 | $112,226 |
| 2021 | $2,449 | $202,097 | $92,071 | $110,026 |
| 2020 | $2,420 | $200,025 | $91,127 | $108,898 |
| 2019 | $2,375 | $196,104 | $89,341 | $106,763 |
| 2018 | $2,345 | $192,260 | $87,590 | $104,670 |
| 2017 | $2,311 | $188,491 | $85,873 | $102,618 |
| 2016 | $2,244 | $184,796 | $84,190 | $100,606 |
| 2015 | $2,232 | $182,021 | $82,926 | $99,095 |
| 2014 | $2,121 | $178,456 | $81,302 | $97,154 |
Source: Public Records
Map
Nearby Homes
- 11851 Riverside Dr Unit 276
- 11851 Riverside Dr Unit 206
- 11851 Riverside Dr Unit SPC 285
- 11949 Riverside Dr Unit 184
- 11949 Riverside Dr Unit 176
- 11949 Riverside Dr Unit 133
- 11949 Riverside Dr Unit 28
- 11949 Riverside Dr Unit 36
- 11949 Riverside Dr Unit 158
- 11949 Riverside Dr Unit 99
- 11436 El Nopal
- 11457 El Nopal
- 12049 Coping Place
- 12212 Rockstream Rd
- 0 Riverford Rd Unit 3
- 11320 El Nopal Unit 5619
- 10252 Riverhill Ln
- 11034 Brookfield Ct
- 10906 Serena Ln
- Hillside 2 Plan at Hillside Meadows
- 11657 Lakeside Ave
- 11659 Lakeside Ave
- 11652 Lakeside Ave
- 11658 Lakeside Ave
- 11627 Lakeside Ave
- 11644 Lakeside Ave
- 11705 Lakeside Ave
- 11619 Lakeside Ave
- 11717 Lakeside Ave
- 11616 Lakeside Ave
- 11718 Lakeside Ave
- 10341 Palm Row Dr
- 11607 Lakeside Ave
- 11706 Rio Corto Dr
- 10367 Palm Row Dr
- 10345 Palm Row Dr
- 11702 Lakeside Ave
- 11721 Lakeside Ave
- 11726 Lakeside Ave
- 11710 Rio Corto Dr
Your Personal Tour Guide
Ask me questions while you tour the home.