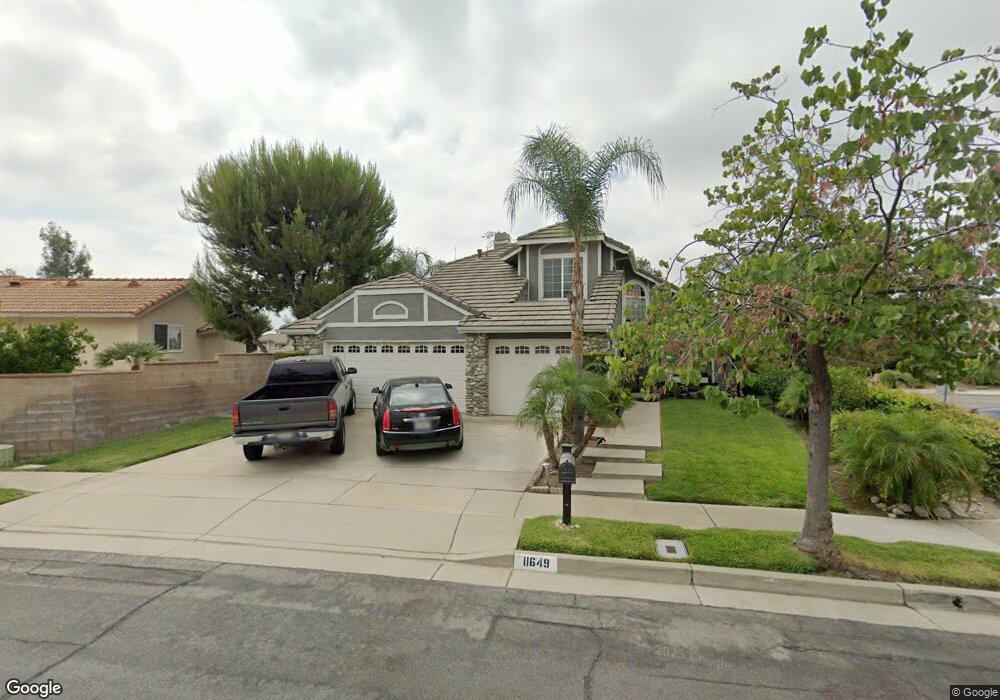
11649 Mount Sherman Ct Rancho Cucamonga, CA 91737
Etiwanda NeighborhoodEstimated Value: $815,000 - $933,000
4
Beds
3
Baths
1,896
Sq Ft
$455/Sq Ft
Est. Value
About This Home
This home is located at 11649 Mount Sherman Ct, Rancho Cucamonga, CA 91737 and is currently estimated at $861,780, approximately $454 per square foot. 11649 Mount Sherman Ct is a home located in San Bernardino County with nearby schools including Caryn Elementary, Day Creek Intermediate, and Los Osos High.
Ownership History
Date
Name
Owned For
Owner Type
Purchase Details
Closed on
Jul 14, 1995
Sold by
Torres Manuel H
Bought by
Magelsen Jens and Magelsen Rebecca A
Current Estimated Value
Home Financials for this Owner
Home Financials are based on the most recent Mortgage that was taken out on this home.
Original Mortgage
$154,934
Interest Rate
7.59%
Mortgage Type
FHA
Create a Home Valuation Report for This Property
The Home Valuation Report is an in-depth analysis detailing your home's value as well as a comparison with similar homes in the area
Home Values in the Area
Average Home Value in this Area
Purchase History
| Date | Buyer | Sale Price | Title Company |
|---|---|---|---|
| Magelsen Jens | $165,500 | Chicago Title Co |
Source: Public Records
Mortgage History
| Date | Status | Borrower | Loan Amount |
|---|---|---|---|
| Closed | Magelsen Jens | $154,934 |
Source: Public Records
Tax History Compared to Growth
Tax History
| Year | Tax Paid | Tax Assessment Tax Assessment Total Assessment is a certain percentage of the fair market value that is determined by local assessors to be the total taxable value of land and additions on the property. | Land | Improvement |
|---|---|---|---|---|
| 2025 | $3,563 | $274,938 | $68,777 | $206,161 |
| 2024 | $3,563 | $269,547 | $67,428 | $202,119 |
| 2023 | $3,471 | $264,262 | $66,106 | $198,156 |
| 2022 | $3,416 | $259,081 | $64,810 | $194,271 |
| 2021 | $3,353 | $254,001 | $63,539 | $190,462 |
| 2020 | $3,306 | $251,396 | $62,887 | $188,509 |
| 2019 | $3,217 | $246,467 | $61,654 | $184,813 |
| 2018 | $3,197 | $241,634 | $60,445 | $181,189 |
| 2017 | $3,062 | $236,896 | $59,260 | $177,636 |
| 2016 | $2,980 | $232,251 | $58,098 | $174,153 |
| 2015 | $3,266 | $228,762 | $57,225 | $171,537 |
| 2014 | $3,185 | $224,281 | $56,104 | $168,177 |
Source: Public Records
Map
Nearby Homes
- 6419 Panorama Ct
- 11537 Mount Hood Ct
- 11839 Antler Peak Ct
- 11571 Pinnacle Peak Ct
- 6530 Catania Place
- 6331 Thunder Mountain Ave
- 11855 Modena Dr
- 6701 Marsala Place
- 6670 Meadowlane Place
- 11344 Sunrise Ct
- 12184 Clydesdale Dr
- 11179 Summerside Ln
- 11376 Starlight Dr
- 12253 Knightsbridge Dr
- 12206 Tunbridge Ct
- 6792 Galveston Place
- 6999 Canosa Place
- 12331 Dove Tree Dr
- 6988 Edinburgh Place
- 10980 Santa Barbara Place
- 5288 Mount Pinos Ct
- 6278 Mount Pinos Ct
- 6298 Mount Pinos Ct
- 11656 Mount Sherman Ct
- 11640 Mount Sterling Ct
- 11648 Mount Rainier Ct
- 11642 Mount Rainier Ct
- 11650 Mount Sterling Ct
- 11664 Mount Sherman Ct
- 6299 Mount Pinos Ct
- 6269 Mount Pinos Ct
- 6289 Mount Pinos Ct
- 11660 Mount Sterling Ct
- 11636 Mount Rainier Ct
- 6279 Mount Pinos Ct
- 11639 Mount Waverly Ct
- 11647 Mount Waverly Ct
- 11672 Mount Sherman Ct
- 11670 Mount Sterling Ct
- 11655 Mount Waverly Ct