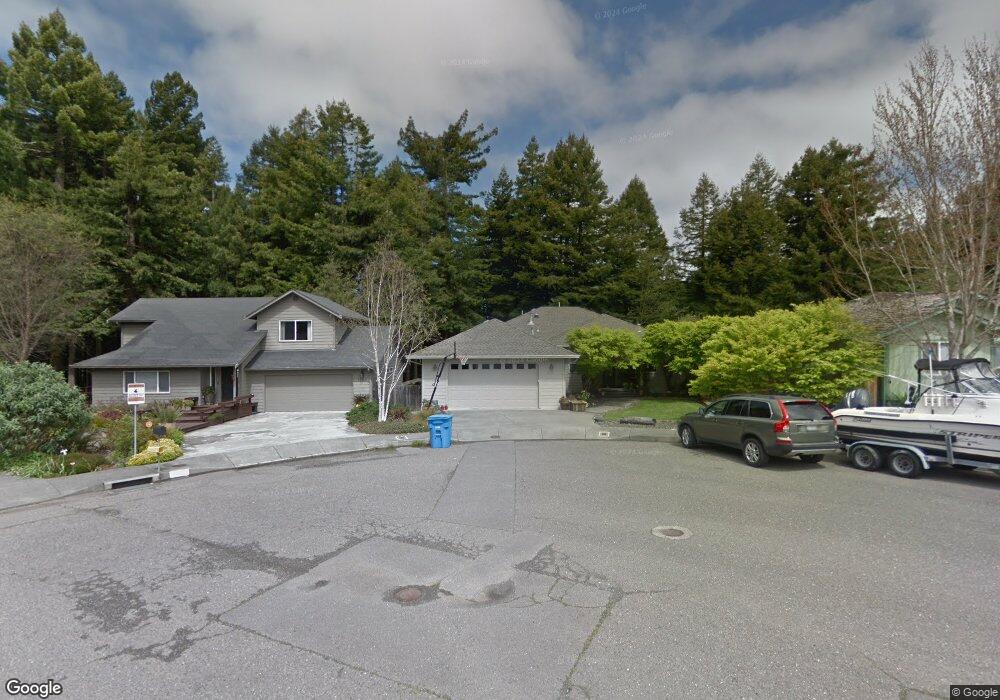
1165 Leslie Rd Eureka, CA 95503
Estimated Value: $409,000 - $550,000
Studio
--
Bath
--
Sq Ft
8,407
Sq Ft Lot
About This Home
This home is located at 1165 Leslie Rd, Eureka, CA 95503 and is currently estimated at $458,115. 1165 Leslie Rd is a home located in Humboldt County with nearby schools including Cutten Elementary School, Ridgewood Elementary School, and Northern United - Humboldt Charter School.
Ownership History
Date
Name
Owned For
Owner Type
Purchase Details
Closed on
Jun 18, 2014
Sold by
Haman Glenn Robert and Cobian Haman Adriana
Bought by
Hamanaka Glenn R and Hamana Adriana
Current Estimated Value
Purchase Details
Closed on
Jan 17, 2002
Sold by
Grate Ronald G and Grate Elizabeth C
Bought by
Hamanaka Glenn Robert and Cobian Hamanaka Adriana
Home Financials for this Owner
Home Financials are based on the most recent Mortgage that was taken out on this home.
Original Mortgage
$44,000
Outstanding Balance
$18,121
Interest Rate
7.15%
Mortgage Type
Seller Take Back
Estimated Equity
$439,994
Create a Home Valuation Report for This Property
The Home Valuation Report is an in-depth analysis detailing your home's value as well as a comparison with similar homes in the area
Purchase History
| Date | Buyer | Sale Price | Title Company |
|---|---|---|---|
| Hamanaka Glenn R | -- | None Available | |
| Hamanaka Glenn Robert | $59,000 | First American Title Ins Co |
Source: Public Records
Mortgage History
| Date | Status | Borrower | Loan Amount |
|---|---|---|---|
| Open | Hamanaka Glenn Robert | $44,000 |
Source: Public Records
Tax History
| Year | Tax Paid | Tax Assessment Tax Assessment Total Assessment is a certain percentage of the fair market value that is determined by local assessors to be the total taxable value of land and additions on the property. | Land | Improvement |
|---|---|---|---|---|
| 2025 | $3,375 | $335,306 | $87,148 | $248,158 |
| 2024 | $3,375 | $328,733 | $85,440 | $243,293 |
| 2023 | $3,326 | $322,288 | $83,765 | $238,523 |
| 2022 | $3,451 | $315,970 | $82,123 | $233,847 |
| 2021 | $3,231 | $309,775 | $80,513 | $229,262 |
| 2020 | $3,206 | $306,600 | $79,688 | $226,912 |
| 2019 | $3,138 | $300,589 | $78,126 | $222,463 |
| 2018 | $3,090 | $294,696 | $76,595 | $218,101 |
| 2017 | $3,073 | $288,919 | $75,094 | $213,825 |
| 2016 | $3,072 | $283,255 | $73,622 | $209,633 |
| 2015 | $3,044 | $279,002 | $72,517 | $206,485 |
| 2014 | $2,844 | $273,538 | $71,097 | $202,441 |
Source: Public Records
Map
Nearby Homes
- 4483 Excelsior Rd
- 1956 Gage Ln
- 1651 Rachel Ln
- 4150 E St
- 1220 Vista Dr
- 0 Brogan Way Unit SR25066460
- 0 Brogan Way Unit 270075
- 3981 F St
- 1599 Fern Dr
- 2005 Foxwood Dr
- 4286 Walnut Dr
- 3923 D St
- 3945 Davis Ct
- 5200 Blackberry Ln
- 3657 H St
- 2021 Mckeown Ln
- 4672 Union St
- 3539 J St
- 4843 Meyers Ave
- 3979 Cedar St
Your Personal Tour Guide
Ask me questions while you tour the home.