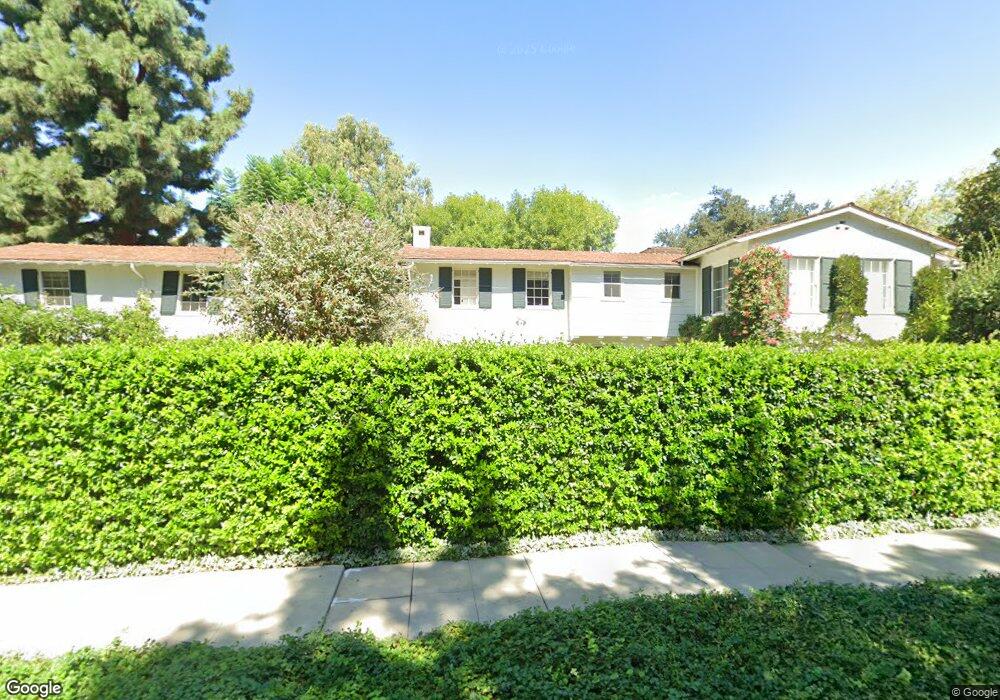
1165 Madia St Pasadena, CA 91103
Linda Vista NeighborhoodEstimated Value: $5,061,000 - $7,008,000
5
Beds
5
Baths
5,670
Sq Ft
$1,040/Sq Ft
Est. Value
About This Home
This home is located at 1165 Madia St, Pasadena, CA 91103 and is currently estimated at $5,894,232, approximately $1,039 per square foot. 1165 Madia St is a home located in Los Angeles County with nearby schools including Octavia E. Butler Magnet, John Muir High School, and Chandler School.
Ownership History
Date
Name
Owned For
Owner Type
Purchase Details
Closed on
Jul 14, 2009
Sold by
Quinn John B
Bought by
Quinn John Badger and Quinn Mary Shannon
Current Estimated Value
Purchase Details
Closed on
Sep 2, 1998
Sold by
Windle F Brown
Bought by
Quinn John B and Shannon Quinn M
Home Financials for this Owner
Home Financials are based on the most recent Mortgage that was taken out on this home.
Original Mortgage
$1,200,000
Outstanding Balance
$255,892
Interest Rate
6.88%
Estimated Equity
$5,638,340
Purchase Details
Closed on
Jul 17, 1998
Sold by
Verbeck Arden R Tr Verbeck Trust
Bought by
Windle F Brown and Windle Stephanie P
Home Financials for this Owner
Home Financials are based on the most recent Mortgage that was taken out on this home.
Original Mortgage
$1,200,000
Outstanding Balance
$255,892
Interest Rate
6.88%
Estimated Equity
$5,638,340
Purchase Details
Closed on
Jan 28, 1998
Sold by
Verbeck Arden R Tr
Bought by
Verbeck Arden R and Coleman Ann R
Create a Home Valuation Report for This Property
The Home Valuation Report is an in-depth analysis detailing your home's value as well as a comparison with similar homes in the area
Home Values in the Area
Average Home Value in this Area
Purchase History
| Date | Buyer | Sale Price | Title Company |
|---|---|---|---|
| Quinn John Badger | -- | None Available | |
| Quinn John B | -- | -- | |
| Windle F Brown | $1,425,000 | -- | |
| Verbeck Arden R | -- | -- |
Source: Public Records
Mortgage History
| Date | Status | Borrower | Loan Amount |
|---|---|---|---|
| Open | Quinn John B | $1,200,000 | |
| Previous Owner | Windle F Brown | $1,000,000 |
Source: Public Records
Tax History
| Year | Tax Paid | Tax Assessment Tax Assessment Total Assessment is a certain percentage of the fair market value that is determined by local assessors to be the total taxable value of land and additions on the property. | Land | Improvement |
|---|---|---|---|---|
| 2025 | $30,011 | $2,665,116 | $1,375,516 | $1,289,600 |
| 2024 | $30,011 | $2,612,860 | $1,348,546 | $1,264,314 |
| 2023 | $29,760 | $2,561,628 | $1,322,104 | $1,239,524 |
| 2022 | $28,720 | $2,511,401 | $1,296,181 | $1,215,220 |
| 2021 | $27,516 | $2,462,159 | $1,270,766 | $1,191,393 |
| 2019 | $26,482 | $2,389,131 | $1,233,075 | $1,156,056 |
| 2018 | $26,985 | $2,342,287 | $1,208,898 | $1,133,389 |
| 2016 | $26,119 | $2,251,335 | $1,161,956 | $1,089,379 |
| 2015 | $25,836 | $2,217,519 | $1,144,503 | $1,073,016 |
| 2014 | $25,295 | $2,174,082 | $1,122,084 | $1,051,998 |
Source: Public Records
Map
Nearby Homes
- 1450 Arroyo View Dr
- 1897 Braemar Rd
- 1480 Vista Ln
- 1918 Linda Vista Ave
- 1155 Linda Vista Ave
- 1905 Kenneth Way
- 1650 Knollwood Dr
- 1331 El Mirador Dr
- 1225 Wabash St
- 1409 El Mirador Dr
- 1625 Pegfair Estates Dr
- 1329 Solita Rd
- 514 W Washington Blvd
- 544 Pepper St
- 0 Haverstock Rd
- 2211 1/8 Casitas Ave
- 546 W Claremont St
- 1758 Lincoln Ave
- 508 Vermont St
- 492 Vermont St
- 1164 Madia St
- 1191 Madia St
- 1199 Madia St
- 1179 Yocum St
- 1190 Madia St
- 1205 Madia St
- 1200 Madia St
- 1204 Madia St
- 1177 Yocum St
- 1546 Linda Vista Ave
- 1568 Linda Vista Ave
- 1556 Linda Vista Ave
- 1590 Linda Vista Ave
- 1518 Linda Vista Ave
- 1169 Yocum St
- 1580 Linda Vista Ave
- 1185 Yocum St
- 1498 Linda Vista Ave
- 1199 Yocum St
- 1490 Linda Vista Ave
Your Personal Tour Guide
Ask me questions while you tour the home.