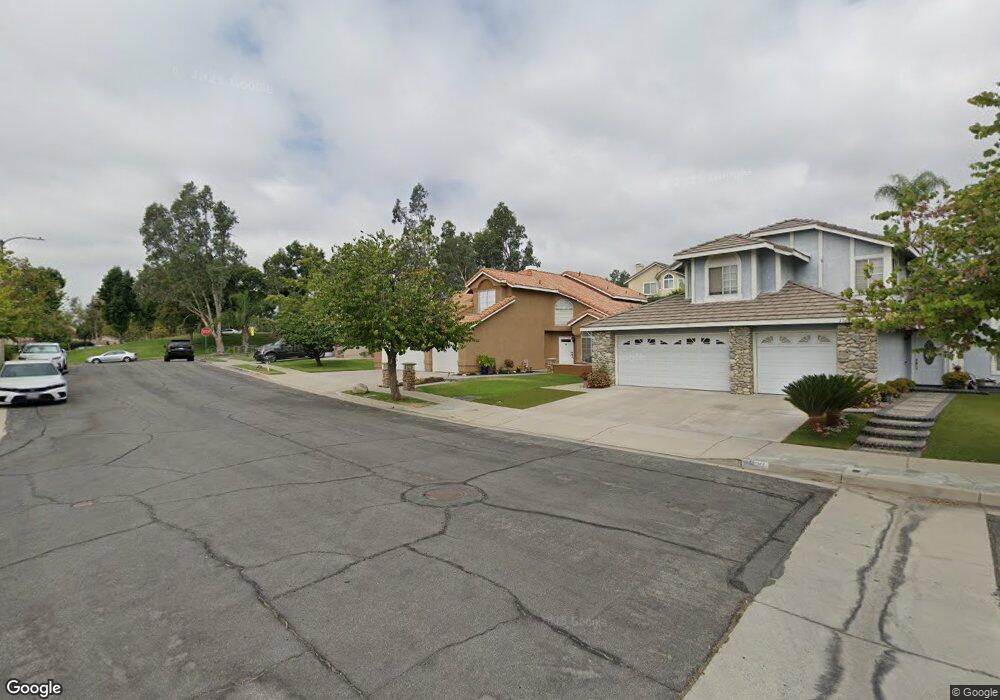
11656 Mount Sherman Ct Rancho Cucamonga, CA 91737
Etiwanda NeighborhoodEstimated Value: $842,057 - $887,000
4
Beds
3
Baths
1,896
Sq Ft
$454/Sq Ft
Est. Value
About This Home
This home is located at 11656 Mount Sherman Ct, Rancho Cucamonga, CA 91737 and is currently estimated at $861,014, approximately $454 per square foot. 11656 Mount Sherman Ct is a home located in San Bernardino County with nearby schools including Caryn Elementary, Day Creek Intermediate, and Los Osos High.
Ownership History
Date
Name
Owned For
Owner Type
Purchase Details
Closed on
Feb 10, 2010
Sold by
Wells Fargo Bank Na
Bought by
Steen Cory R and Steen Rebecca L
Current Estimated Value
Home Financials for this Owner
Home Financials are based on the most recent Mortgage that was taken out on this home.
Original Mortgage
$379,990
Outstanding Balance
$254,242
Interest Rate
5.25%
Mortgage Type
FHA
Estimated Equity
$606,772
Purchase Details
Closed on
Dec 7, 2009
Sold by
Hunter Jimmy and Hunter Alexis C
Bought by
Wells Fargo Bank Na
Purchase Details
Closed on
Dec 10, 2003
Sold by
Perez Eduardo D and Perez Maria D
Bought by
Hunter Jimmy and Hunter Alexis C
Home Financials for this Owner
Home Financials are based on the most recent Mortgage that was taken out on this home.
Original Mortgage
$288,800
Interest Rate
5.88%
Mortgage Type
Purchase Money Mortgage
Create a Home Valuation Report for This Property
The Home Valuation Report is an in-depth analysis detailing your home's value as well as a comparison with similar homes in the area
Home Values in the Area
Average Home Value in this Area
Purchase History
| Date | Buyer | Sale Price | Title Company |
|---|---|---|---|
| Steen Cory R | $387,000 | Fidelity National Title Co | |
| Wells Fargo Bank Na | $303,600 | Accommodation | |
| Hunter Jimmy | $361,000 | First American | |
| Perez Eduardo D | -- | First American |
Source: Public Records
Mortgage History
| Date | Status | Borrower | Loan Amount |
|---|---|---|---|
| Open | Steen Cory R | $379,990 | |
| Previous Owner | Hunter Jimmy | $288,800 |
Source: Public Records
Tax History
| Year | Tax Paid | Tax Assessment Tax Assessment Total Assessment is a certain percentage of the fair market value that is determined by local assessors to be the total taxable value of land and additions on the property. | Land | Improvement |
|---|---|---|---|---|
| 2025 | $6,098 | $499,551 | $174,261 | $325,290 |
| 2024 | $5,926 | $489,756 | $170,844 | $318,912 |
| 2023 | $5,778 | $480,153 | $167,494 | $312,659 |
| 2022 | $5,699 | $470,738 | $164,210 | $306,528 |
| 2021 | $5,598 | $461,508 | $160,990 | $300,518 |
| 2020 | $5,520 | $456,776 | $159,339 | $297,437 |
| 2019 | $5,368 | $447,820 | $156,215 | $291,605 |
| 2018 | $5,344 | $439,039 | $153,152 | $285,887 |
| 2017 | $5,108 | $430,430 | $150,149 | $280,281 |
| 2016 | $4,966 | $421,990 | $147,205 | $274,785 |
| 2015 | $5,239 | $415,651 | $144,994 | $270,657 |
| 2014 | $5,098 | $407,509 | $142,154 | $265,355 |
Source: Public Records
Map
Nearby Homes
- 11888 White Mountain Ct
- 11570 Pinnacle Peak Ct
- 11571 Pinnacle Peak Ct
- 11432 Mount Baxter St
- 6527 Monte Carlo Place
- 11537 Cotton Cloud Dr
- 11827 Modena Dr
- 11855 Modena Dr
- 11238 Skyview Ln
- 6670 Meadowlane Place
- 12202 Canyon Meadows Dr
- 11179 Summerside Ln
- 12184 Clydesdale Dr
- 6598 Bradford Ct
- 11208 Wingate Dr
- 11621 Pavia Dr
- 11616 Portofino Dr
- 11518 Lomello Way
- 12161 Split Rein Dr
- 6336 Taylor Canyon Place
- 11664 Mount Sherman Ct
- 11648 Mount Sherman Ct
- 11647 Mount Waverly Ct
- 11655 Mount Waverly Ct
- 11672 Mount Sherman Ct
- 6278 Mount Pinos Ct
- 11639 Mount Waverly Ct
- 11663 Mount Waverly Ct
- 11680 Mount Sherman Ct
- 11649 Mount Sherman Ct
- 6269 Mount Pinos Ct
- 11671 Mount Waverly Ct
- 5288 Mount Pinos Ct
- 11688 Mount Sherman Ct
- 6279 Mount Pinos Ct
- 11648 Mount Waverly Ct
- 11679 Mount Waverly Ct
- 11656 Mount Waverly Ct
- 11640 Mount Waverly Ct
- 6298 Mount Pinos Ct
Your Personal Tour Guide
Ask me questions while you tour the home.