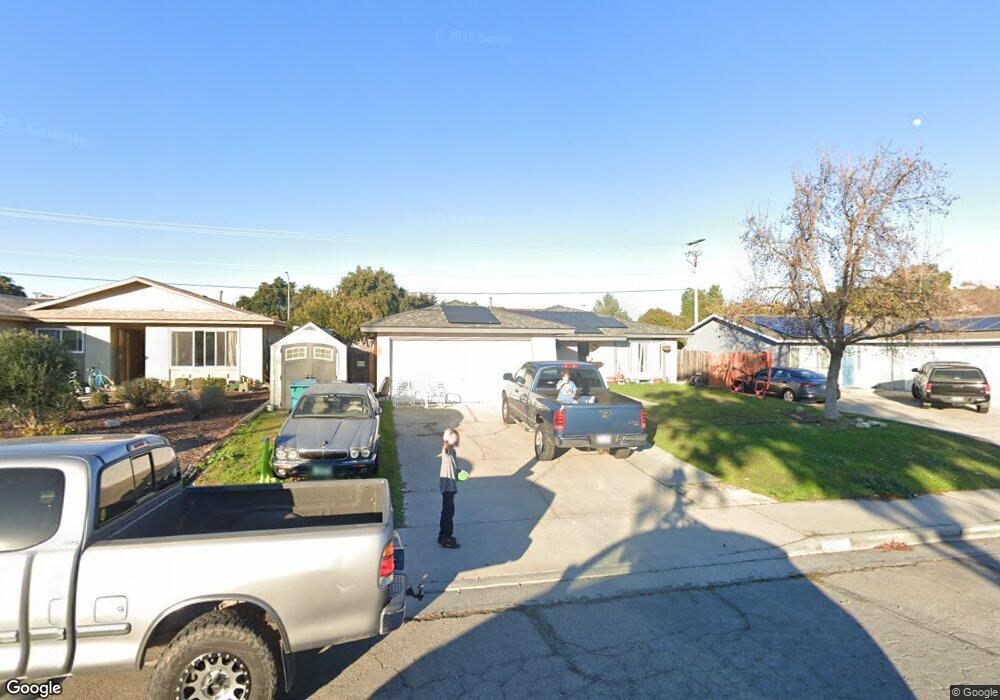
1169 Dorothy St Paso Robles, CA 93446
Estimated Value: $633,977 - $646,000
3
Beds
2
Baths
1,339
Sq Ft
$478/Sq Ft
Est. Value
About This Home
This home is located at 1169 Dorothy St, Paso Robles, CA 93446 and is currently estimated at $640,244, approximately $478 per square foot. 1169 Dorothy St is a home located in San Luis Obispo County with nearby schools including Winifred Pifer Elementary School, Daniel Lewis Middle School, and Paso Robles High School.
Ownership History
Date
Name
Owned For
Owner Type
Purchase Details
Closed on
May 5, 2021
Sold by
Halverson Julie D
Bought by
Bedolla Justin and Bedolla Kerby
Current Estimated Value
Home Financials for this Owner
Home Financials are based on the most recent Mortgage that was taken out on this home.
Original Mortgage
$441,595
Outstanding Balance
$400,195
Interest Rate
3.1%
Mortgage Type
FHA
Estimated Equity
$240,049
Purchase Details
Closed on
Feb 3, 2021
Sold by
Halverson Julie D and Janice A Dawes Qtip Trust
Bought by
Halverson Julie D
Purchase Details
Closed on
Sep 10, 2018
Sold by
Dawes Duane H and Duane And Janice Dawes Trust
Bought by
Dawes Duane H and Janice A Dawes Qtip Trust
Purchase Details
Closed on
Jul 26, 1994
Sold by
Dawes Duane H and Dawes Janice A
Bought by
Dawes Duane H and Dawes Janice A
Create a Home Valuation Report for This Property
The Home Valuation Report is an in-depth analysis detailing your home's value as well as a comparison with similar homes in the area
Home Values in the Area
Average Home Value in this Area
Purchase History
| Date | Buyer | Sale Price | Title Company |
|---|---|---|---|
| Bedolla Justin | $450,000 | Placer Title Company | |
| Halverson Julie D | -- | None Listed On Document | |
| Dawes Duane H | -- | None Available | |
| Dawes Duane H | -- | -- |
Source: Public Records
Mortgage History
| Date | Status | Borrower | Loan Amount |
|---|---|---|---|
| Open | Bedolla Justin | $441,595 |
Source: Public Records
Tax History Compared to Growth
Tax History
| Year | Tax Paid | Tax Assessment Tax Assessment Total Assessment is a certain percentage of the fair market value that is determined by local assessors to be the total taxable value of land and additions on the property. | Land | Improvement |
|---|---|---|---|---|
| 2025 | $6,135 | $562,862 | $216,485 | $346,377 |
| 2024 | $6,035 | $551,827 | $212,241 | $339,586 |
| 2023 | $6,035 | $541,008 | $208,080 | $332,928 |
| 2022 | $5,945 | $530,400 | $204,000 | $326,400 |
| 2021 | $1,841 | $163,796 | $58,927 | $104,869 |
| 2020 | $1,816 | $162,117 | $58,323 | $103,794 |
| 2019 | $1,790 | $158,939 | $57,180 | $101,759 |
| 2018 | $1,766 | $155,823 | $56,059 | $99,764 |
| 2017 | $1,660 | $152,768 | $54,960 | $97,808 |
| 2016 | $1,628 | $149,774 | $53,883 | $95,891 |
| 2015 | $1,622 | $147,525 | $53,074 | $94,451 |
| 2014 | $1,565 | $144,636 | $52,035 | $92,601 |
Source: Public Records
Map
Nearby Homes
- 945 Creston Rd
- 715 Orchard Dr
- 210 Partridge Ave
- 225 Lark Dr
- 1024 Rachel Ln
- 230 Partridge Ave
- 833 Rolling Hills Rd Unit 16
- 340 Nightingale Ave
- 845 Creston Rd
- 1320 Teal Ave
- 326 Partridge Ave
- 4 Dove Ct
- 821 Marlbank Place
- 726 N Trigo Ln
- 470 Nickerson Dr
- 925 Osos Way
- 928 Austin Ct
- 959 Vista Cerro Dr
- 928 Moody Ct
- 629 Trigo Ln
- 1173 Dorothy St
- 1161 Dorothy St
- 1157 Dorothy St
- 1170 Dorothy St
- 1166 Dorothy St
- 1185 Dorothy St
- 1176 Dorothy St
- 1158 Dorothy St
- 1131 Dorothy St
- 1180 Dorothy St
- 1140 Dorothy St
- 1205 Dorothy St
- 1203 Frances St
- 1123 Dorothy St
- 1207 Elaine St
- 1130 Dorothy St
- 1206 Frances St
- 1211 Elaine St
- 1204 Dorothy St
- 1207 Dorothy St