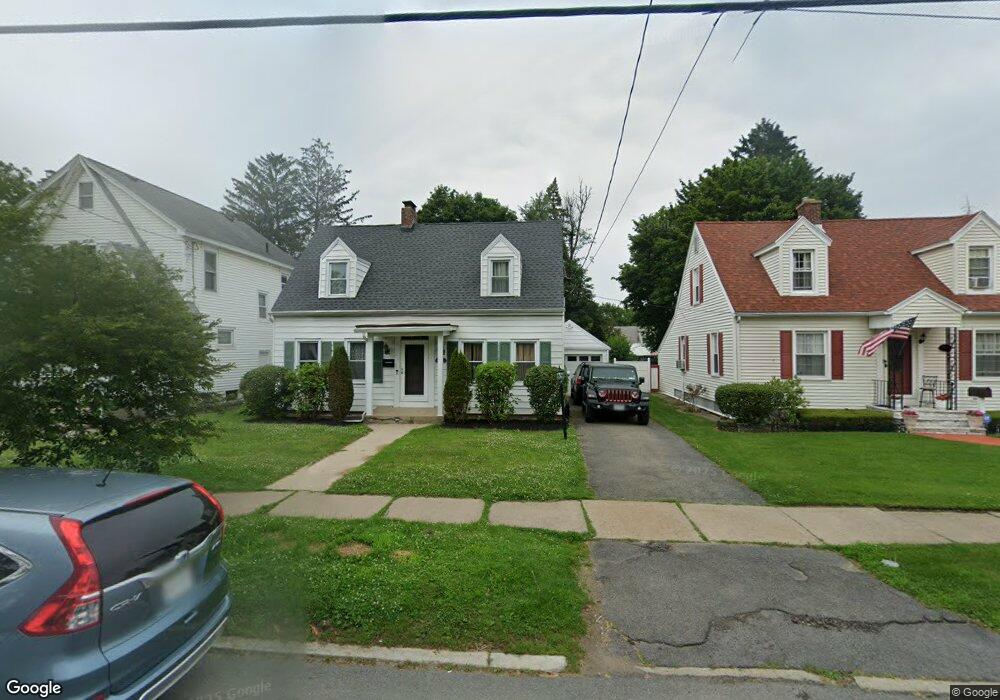
1169 Mc Clellan St Schenectady, NY 12309
Estimated Value: $260,000 - $274,527
3
Beds
2
Baths
1,400
Sq Ft
$193/Sq Ft
Est. Value
About This Home
This home is located at 1169 Mc Clellan St, Schenectady, NY 12309 and is currently estimated at $270,382, approximately $193 per square foot. 1169 Mc Clellan St is a home located in Schenectady County with nearby schools including Howe Elementary School, Oneida Middle School, and Schenectady High School.
Ownership History
Date
Name
Owned For
Owner Type
Purchase Details
Closed on
Jul 18, 2014
Sold by
Chambers Nancy
Bought by
Poulton Tara P and Vergona Marie R
Current Estimated Value
Home Financials for this Owner
Home Financials are based on the most recent Mortgage that was taken out on this home.
Original Mortgage
$114,880
Outstanding Balance
$88,285
Interest Rate
4.4%
Mortgage Type
FHA
Estimated Equity
$182,097
Purchase Details
Closed on
Jun 6, 2006
Sold by
Ruzzo Theresa A
Bought by
Chambers Nancy
Home Financials for this Owner
Home Financials are based on the most recent Mortgage that was taken out on this home.
Original Mortgage
$100,000
Interest Rate
6.59%
Mortgage Type
Unknown
Purchase Details
Closed on
Jul 19, 1999
Sold by
Bywater Judith E
Bought by
Ruzzo Theresa A
Create a Home Valuation Report for This Property
The Home Valuation Report is an in-depth analysis detailing your home's value as well as a comparison with similar homes in the area
Home Values in the Area
Average Home Value in this Area
Purchase History
| Date | Buyer | Sale Price | Title Company |
|---|---|---|---|
| Poulton Tara P | $117,000 | None Available | |
| Chambers Nancy | $120,000 | Maura Mottolese | |
| Ruzzo Theresa A | $87,000 | Rebecca Hout |
Source: Public Records
Mortgage History
| Date | Status | Borrower | Loan Amount |
|---|---|---|---|
| Open | Poulton Tara P | $114,880 | |
| Previous Owner | Chambers Nancy | $100,000 |
Source: Public Records
Tax History Compared to Growth
Tax History
| Year | Tax Paid | Tax Assessment Tax Assessment Total Assessment is a certain percentage of the fair market value that is determined by local assessors to be the total taxable value of land and additions on the property. | Land | Improvement |
|---|---|---|---|---|
| 2024 | $5,512 | $123,000 | $18,500 | $104,500 |
| 2023 | $5,512 | $123,000 | $18,500 | $104,500 |
| 2022 | $5,396 | $123,000 | $18,500 | $104,500 |
| 2021 | $5,307 | $123,000 | $18,500 | $104,500 |
| 2020 | $5,180 | $123,000 | $18,500 | $104,500 |
| 2019 | $3,284 | $123,000 | $18,500 | $104,500 |
| 2018 | $5,173 | $123,000 | $18,500 | $104,500 |
| 2017 | $4,874 | $123,000 | $18,500 | $104,500 |
| 2016 | $5,378 | $123,000 | $18,500 | $104,500 |
| 2015 | -- | $123,000 | $18,500 | $104,500 |
| 2014 | -- | $123,000 | $18,500 | $104,500 |
Source: Public Records
Map
Nearby Homes
- 1185 Sumner Ave
- 1643 Rugby Rd
- 1245 Sumner Ave
- 1250 Sumner Ave
- 1491 Rugby Rd
- 1508 Union St
- 1123 Ardsley Rd
- 1412 Rugby Rd
- 1561 Union St
- 1306 Garner Ave
- 1304 Baker Ave
- 1659 Eastern Pkwy
- 1369 Baker Ave
- 1706 Eastern Pkwy
- 1563 Grand Blvd
- 1055 Ardsley Rd
- 1756 Eastern Pkwy
- 1760 Eastern Pkwy
- 1106 Parkwood Blvd
- 1191 Eastern Ave
- 1169 Mcclellan St
- 1165 Mc Clellan St
- 1173 Mcclellan St
- 1165 Mcclellan St
- 1177 Mcclellan St
- 1177 Mc Clellan St
- 1161 Mcclellan St
- 1181 Mcclellan St
- 1181 Mc Clellan St
- 1159 Mcclellan St
- 1168 Mc Clellan St
- 1182 van Curler Ave
- 1185 Mcclellan St
- 1180 van Curler Ave
- 1185 Mc Clellan St
- 1174 Mcclellan St
- 1196 van Curler Ave
- 1192 van Curler Ave
- 1157 Mcclellan St
- 1178 Mcclellan St