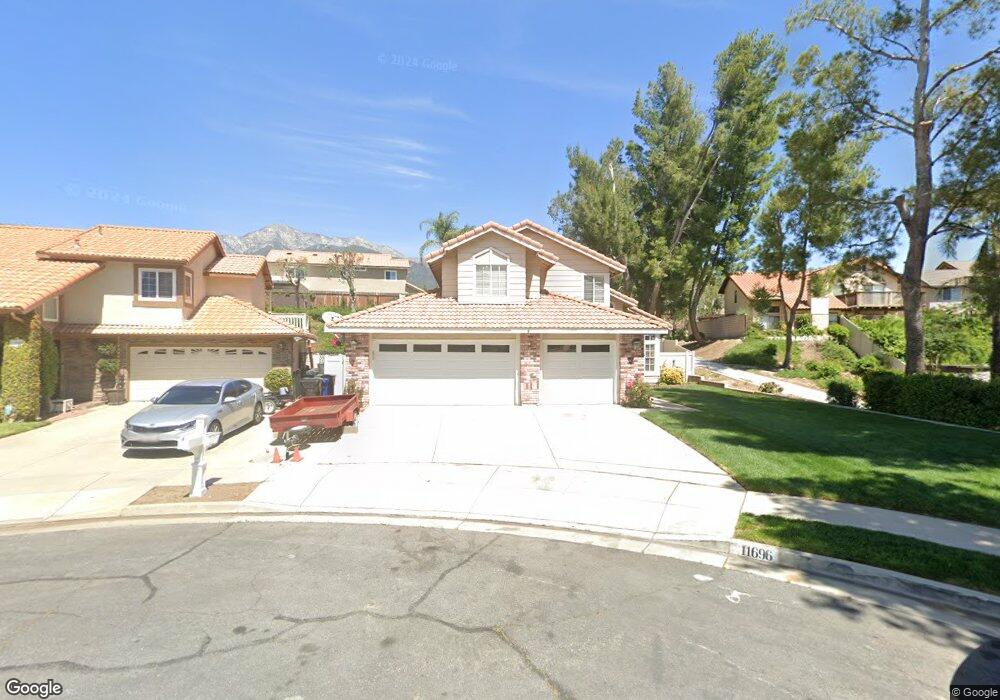
11696 Mount Waverly Ct Rancho Cucamonga, CA 91737
Etiwanda NeighborhoodEstimated Value: $762,731 - $850,000
3
Beds
3
Baths
1,542
Sq Ft
$525/Sq Ft
Est. Value
About This Home
This home is located at 11696 Mount Waverly Ct, Rancho Cucamonga, CA 91737 and is currently estimated at $810,183, approximately $525 per square foot. 11696 Mount Waverly Ct is a home located in San Bernardino County with nearby schools including Caryn Elementary, Day Creek Intermediate, and Los Osos High.
Ownership History
Date
Name
Owned For
Owner Type
Purchase Details
Closed on
May 5, 2005
Sold by
Vidaurrazaga Steve
Bought by
Vidaurrazaga Steve
Current Estimated Value
Home Financials for this Owner
Home Financials are based on the most recent Mortgage that was taken out on this home.
Original Mortgage
$276,250
Interest Rate
5.87%
Mortgage Type
New Conventional
Create a Home Valuation Report for This Property
The Home Valuation Report is an in-depth analysis detailing your home's value as well as a comparison with similar homes in the area
Home Values in the Area
Average Home Value in this Area
Purchase History
| Date | Buyer | Sale Price | Title Company |
|---|---|---|---|
| Vidaurrazaga Steve | -- | United Title |
Source: Public Records
Mortgage History
| Date | Status | Borrower | Loan Amount |
|---|---|---|---|
| Closed | Vidaurrazaga Steve | $276,250 |
Source: Public Records
Tax History Compared to Growth
Tax History
| Year | Tax Paid | Tax Assessment Tax Assessment Total Assessment is a certain percentage of the fair market value that is determined by local assessors to be the total taxable value of land and additions on the property. | Land | Improvement |
|---|---|---|---|---|
| 2025 | $3,467 | $258,671 | $64,667 | $194,004 |
| 2024 | $3,467 | $253,599 | $63,399 | $190,200 |
| 2023 | $3,378 | $248,627 | $62,156 | $186,471 |
| 2022 | $3,326 | $243,752 | $60,937 | $182,815 |
| 2021 | $3,266 | $238,972 | $59,742 | $179,230 |
| 2020 | $3,221 | $236,521 | $59,129 | $177,392 |
| 2019 | $3,136 | $231,884 | $57,970 | $173,914 |
| 2018 | $3,117 | $227,337 | $56,833 | $170,504 |
| 2017 | $2,988 | $222,880 | $55,719 | $167,161 |
| 2016 | $2,909 | $218,509 | $54,626 | $163,883 |
| 2015 | $3,197 | $215,226 | $53,805 | $161,421 |
| 2014 | $3,120 | $211,010 | $52,751 | $158,259 |
Source: Public Records
Map
Nearby Homes
- 6419 Panorama Ct
- 11537 Mount Hood Ct
- 6331 Thunder Mountain Ave
- 11839 Antler Peak Ct
- 11571 Pinnacle Peak Ct
- 6393 Kettle Peak Place
- 6530 Catania Place
- 12184 Clydesdale Dr
- 11855 Modena Dr
- 6701 Marsala Place
- 6670 Meadowlane Place
- 11344 Sunrise Ct
- 11179 Summerside Ln
- 11376 Starlight Dr
- 12253 Knightsbridge Dr
- 12206 Tunbridge Ct
- 12406 Challendon Dr
- 12331 Dove Tree Dr
- 11021 Cedar Creek Dr
- 12430 Split Rein Dr
- 11688 Mount Waverly Ct
- 11708 Mount Gunnison Ct
- 11709 Mount Cambridge Ct
- 11680 Mount Waverly Ct
- 11683 Mount Baker Ct
- 11718 Mount Gunnison Ct
- 11719 Mount Cambridge Ct
- 11672 Mount Waverly Ct
- 11675 Mount Baker Ct
- 11687 Mount Waverly Ct
- 11679 Mount Waverly Ct
- 11728 Mount Gunnison Ct
- 11729 Mount Cambridge Ct
- 11709 Mount Gunnison Ct
- 11667 Mount Baker Ct
- 11664 Mount Waverly Ct
- 11719 Mount Gunnison Ct
- 11671 Mount Waverly Ct
- 11690 Mount Baker Ct
- 11682 Mount Baker Ct