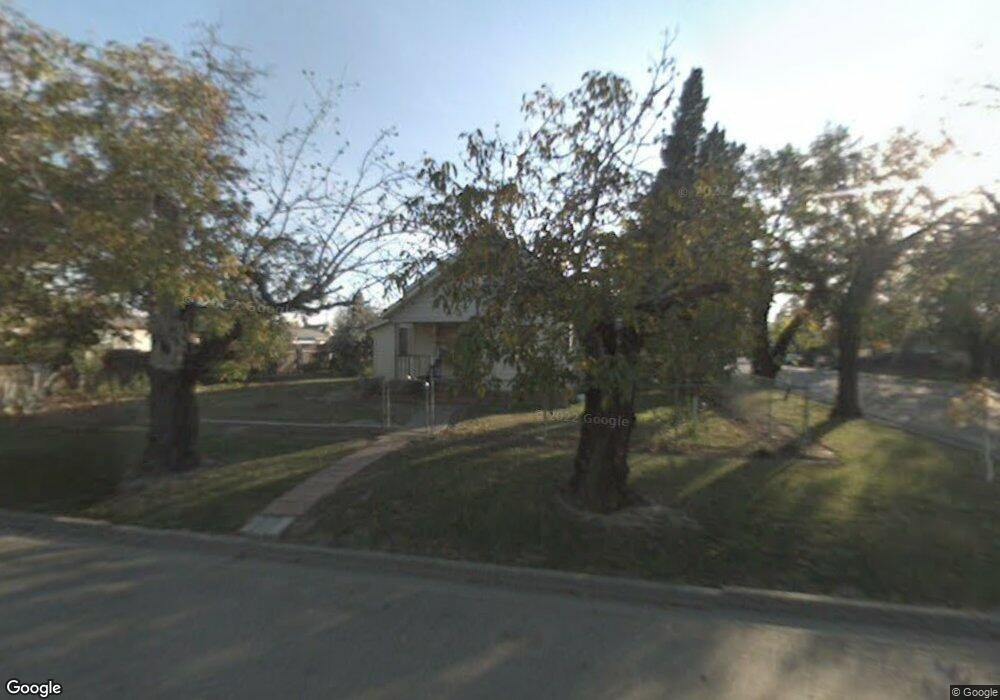
117 E Clay St Colusa, CA 95932
Estimated Value: $148,000 - $365,000
3
Beds
2
Baths
1,110
Sq Ft
$239/Sq Ft
Est. Value
About This Home
This home is located at 117 E Clay St, Colusa, CA 95932 and is currently estimated at $265,777, approximately $239 per square foot. 117 E Clay St is a home located in Colusa County with nearby schools including James M. Burchfield Primary School, George T. Egling Middle School, and Colusa High School.
Ownership History
Date
Name
Owned For
Owner Type
Purchase Details
Closed on
Apr 10, 2023
Sold by
Rogers Judith M
Bought by
Rogers John Anthony
Current Estimated Value
Purchase Details
Closed on
Mar 3, 2009
Sold by
Us Bank National Association
Bought by
Abel S William and Abel Catherine A
Purchase Details
Closed on
Dec 15, 2008
Sold by
Granados Antonio V and Granados Martha V
Bought by
Us Bank National Association
Purchase Details
Closed on
Jul 9, 2003
Sold by
J R & Sons Inc
Bought by
Granados Antonio V and Granados Martha V
Home Financials for this Owner
Home Financials are based on the most recent Mortgage that was taken out on this home.
Original Mortgage
$82,500
Interest Rate
5.15%
Mortgage Type
Purchase Money Mortgage
Create a Home Valuation Report for This Property
The Home Valuation Report is an in-depth analysis detailing your home's value as well as a comparison with similar homes in the area
Home Values in the Area
Average Home Value in this Area
Purchase History
| Date | Buyer | Sale Price | Title Company |
|---|---|---|---|
| Rogers John Anthony | -- | None Listed On Document | |
| Abel S William | $62,000 | Old Republic Title Company | |
| Us Bank National Association | $64,914 | None Available | |
| Granados Antonio V | $82,500 | Western Title Colusa County |
Source: Public Records
Mortgage History
| Date | Status | Borrower | Loan Amount |
|---|---|---|---|
| Previous Owner | Granados Antonio V | $82,500 |
Source: Public Records
Tax History
| Year | Tax Paid | Tax Assessment Tax Assessment Total Assessment is a certain percentage of the fair market value that is determined by local assessors to be the total taxable value of land and additions on the property. | Land | Improvement |
|---|---|---|---|---|
| 2025 | $1,778 | $154,669 | $52,414 | $102,255 |
| 2024 | $1,778 | $151,637 | $51,387 | $100,250 |
| 2023 | $960 | $76,726 | $27,223 | $49,503 |
| 2022 | $960 | $75,223 | $26,690 | $48,533 |
| 2021 | $926 | $73,749 | $26,167 | $47,582 |
| 2020 | $916 | $72,994 | $25,899 | $47,095 |
| 2019 | $894 | $71,564 | $25,392 | $46,172 |
| 2018 | $893 | $70,162 | $24,895 | $45,267 |
| 2017 | $881 | $68,787 | $24,407 | $44,380 |
| 2016 | $871 | $67,439 | $23,929 | $43,510 |
| 2015 | $845 | $66,427 | $23,570 | $42,857 |
| 2014 | $806 | $65,127 | $23,109 | $42,018 |
Source: Public Records
Map
Nearby Homes
- 35 Parkhill St
- 121 Lafayette St
- 130 Fremont St
- 0 E Carson St Unit 225122408
- 1003 4th St
- 528 Clay St
- 7300 Farinon Rd
- 243 7th St
- 724 Webster St
- 738 Webster St
- 731 Sioc St
- 0 Ware Ave
- 1425 5th St
- 251 Allen Cir
- 139 Country Club Dr
- 616 12th St
- 351 Sequoia Way
- 207 Country Club Dr
- 212 Country Club Dr
- 23 Walnut Tree Dr
Your Personal Tour Guide
Ask me questions while you tour the home.