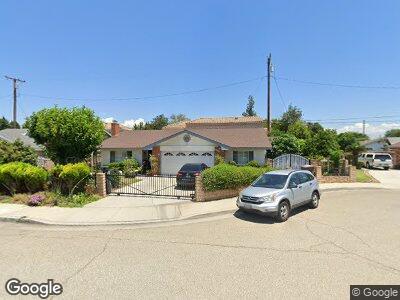
11713 Pickering Way El Monte, CA 91732
Norwood Cherrylee NeighborhoodEstimated Value: $789,000 - $897,000
3
Beds
2
Baths
1,560
Sq Ft
$539/Sq Ft
Est. Value
About This Home
This home is located at 11713 Pickering Way, El Monte, CA 91732 and is currently estimated at $841,399, approximately $539 per square foot. 11713 Pickering Way is a home located in Los Angeles County with nearby schools including Durfee School, Arroyo High School, and Shield of Faith Christian School.
Ownership History
Date
Name
Owned For
Owner Type
Purchase Details
Closed on
Sep 14, 2001
Sold by
Lee Randy Nam and Nguyen Hoang Thi Kim
Bought by
Lee Randy Nam and Nguyen Hoang Thi Kim
Current Estimated Value
Home Financials for this Owner
Home Financials are based on the most recent Mortgage that was taken out on this home.
Original Mortgage
$118,000
Interest Rate
6.99%
Purchase Details
Closed on
Aug 4, 1997
Sold by
Kuo Hsien Tong and Hui Chun Tong
Bought by
Lee Randy Nam and Nguyen Hoang Thi Kim
Home Financials for this Owner
Home Financials are based on the most recent Mortgage that was taken out on this home.
Original Mortgage
$124,000
Interest Rate
7.43%
Purchase Details
Closed on
Jun 10, 1997
Sold by
Lancaster Kenneth G
Bought by
Lancaster Hui Chun Tong
Home Financials for this Owner
Home Financials are based on the most recent Mortgage that was taken out on this home.
Original Mortgage
$124,000
Interest Rate
7.43%
Create a Home Valuation Report for This Property
The Home Valuation Report is an in-depth analysis detailing your home's value as well as a comparison with similar homes in the area
Home Values in the Area
Average Home Value in this Area
Purchase History
| Date | Buyer | Sale Price | Title Company |
|---|---|---|---|
| Lee Randy Nam | -- | Southland Title Company | |
| Lee Randy Nam | $155,000 | Equity Title | |
| Lancaster Hui Chun Tong | -- | Equity Title Company |
Source: Public Records
Mortgage History
| Date | Status | Borrower | Loan Amount |
|---|---|---|---|
| Closed | Lee Randy Nam | $110,000 | |
| Closed | Lee Randy Nam | $118,000 | |
| Closed | Lee Randy Nam | $124,000 |
Source: Public Records
Tax History Compared to Growth
Tax History
| Year | Tax Paid | Tax Assessment Tax Assessment Total Assessment is a certain percentage of the fair market value that is determined by local assessors to be the total taxable value of land and additions on the property. | Land | Improvement |
|---|---|---|---|---|
| 2024 | $3,638 | $242,618 | $97,984 | $144,634 |
| 2023 | $3,565 | $237,862 | $96,063 | $141,799 |
| 2022 | $3,438 | $233,199 | $94,180 | $139,019 |
| 2021 | $3,469 | $228,628 | $92,334 | $136,294 |
| 2019 | $3,528 | $221,849 | $89,597 | $132,252 |
| 2018 | $3,413 | $217,500 | $87,841 | $129,659 |
| 2016 | $3,263 | $209,056 | $84,431 | $124,625 |
| 2015 | $3,224 | $205,917 | $83,163 | $122,754 |
| 2014 | $3,106 | $201,884 | $81,534 | $120,350 |
Source: Public Records
Map
Nearby Homes
- 11722 Pickering Way
- 11829 Roseglen St
- 4849 Peck Rd Unit 48
- 4849 Peck Rd
- 4937 Peck Rd Unit C
- 11584 Hallwood Dr
- 4436 La Madera Ave
- 5021 Peck Rd Unit 9
- 11518 Mcgirk Ave
- 4540 Instar Place
- 5140 Elrovia Ave
- 11825 Basye St
- 11541 Basye St
- 11173 Mcgirk Ave
- 11100 Lower Azusa Rd
- 4730 Bannister Ave
- 11834 Kerrwood St
- 11358 Frankmont St
- 4155 Elrovia Ave
- 4346 Cypress Ave
- 11713 Pickering Way
- 11701 Pickering Way
- 11720 Lower Azusa Rd
- 4710 Richwood Ave
- 11718 Lower Azusa Rd
- 11679 Pickering Way
- 11722 Lower Azusa Rd
- 11720 Pickering Way
- 4711 Richwood Ave
- 4706 Richwood Ave
- 11732 1/2 Lower Azusa Rd
- 11732 Lower Azusa Rd
- 11716 Lower Azusa Rd
- 11724 Lower Azusa Rd
- 11667 Pickering Way
- 11723 Ranchito St
- 11675 Ranchito St
- 11721 Ranchito St
- 4704 Richwood Ave
- 11714 Lower Azusa Rd