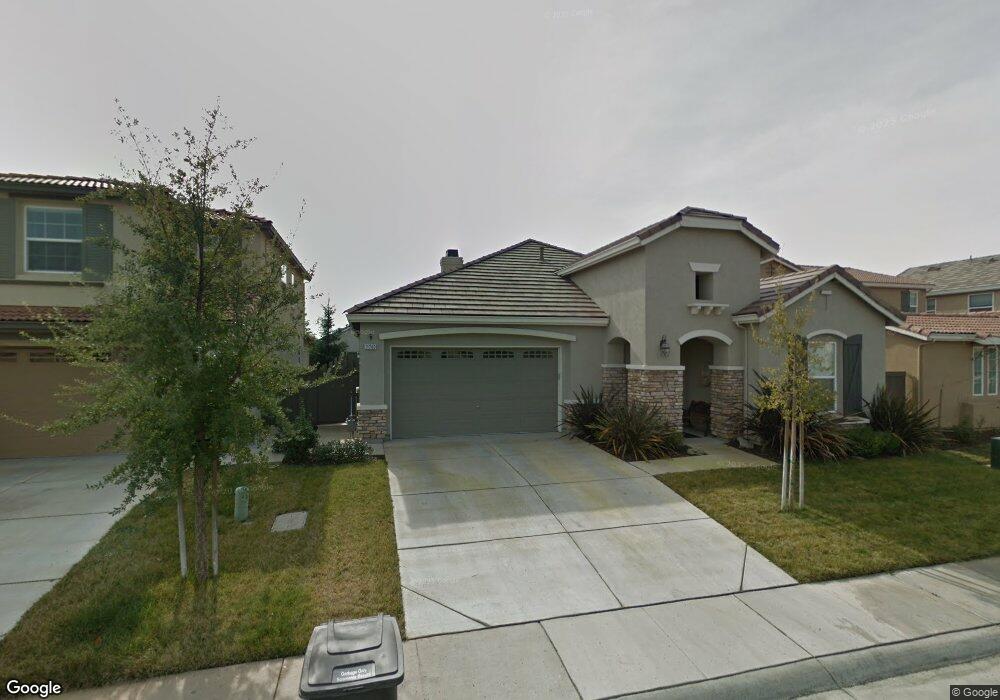
11740 Arista Way Rancho Cordova, CA 95742
Anatolia NeighborhoodEstimated Value: $532,000 - $587,000
3
Beds
2
Baths
2,001
Sq Ft
$282/Sq Ft
Est. Value
About This Home
This home is located at 11740 Arista Way, Rancho Cordova, CA 95742 and is currently estimated at $564,684, approximately $282 per square foot. 11740 Arista Way is a home located in Sacramento County with nearby schools including Sunrise Elementary School, Katherine L. Albiani Middle School, and Pleasant Grove High School.
Ownership History
Date
Name
Owned For
Owner Type
Purchase Details
Closed on
Mar 3, 2015
Sold by
Mcguire James B
Bought by
Mcguire James B and Mcguire Carrie Jane
Current Estimated Value
Purchase Details
Closed on
Sep 21, 2009
Sold by
Ross Carrie Jane and Tapp Derreck Drew
Bought by
Mcguire James B
Home Financials for this Owner
Home Financials are based on the most recent Mortgage that was taken out on this home.
Original Mortgage
$161,250
Outstanding Balance
$104,866
Interest Rate
5.08%
Mortgage Type
New Conventional
Estimated Equity
$459,818
Purchase Details
Closed on
Feb 24, 2006
Sold by
Tim Lewis Communities
Bought by
Ross Carrie Jane and Tapp Derreck Drew
Home Financials for this Owner
Home Financials are based on the most recent Mortgage that was taken out on this home.
Original Mortgage
$371,500
Interest Rate
6.15%
Mortgage Type
Fannie Mae Freddie Mac
Create a Home Valuation Report for This Property
The Home Valuation Report is an in-depth analysis detailing your home's value as well as a comparison with similar homes in the area
Home Values in the Area
Average Home Value in this Area
Purchase History
| Date | Buyer | Sale Price | Title Company |
|---|---|---|---|
| Mcguire James B | -- | None Available | |
| Mcguire James B | $215,000 | Chicago Title Company | |
| Ross Carrie Jane | $464,500 | Placer Title Company |
Source: Public Records
Mortgage History
| Date | Status | Borrower | Loan Amount |
|---|---|---|---|
| Open | Mcguire James B | $161,250 | |
| Previous Owner | Ross Carrie Jane | $371,500 |
Source: Public Records
Tax History Compared to Growth
Tax History
| Year | Tax Paid | Tax Assessment Tax Assessment Total Assessment is a certain percentage of the fair market value that is determined by local assessors to be the total taxable value of land and additions on the property. | Land | Improvement |
|---|---|---|---|---|
| 2025 | $5,659 | $277,509 | $90,349 | $187,160 |
| 2024 | $5,659 | $272,069 | $88,578 | $183,491 |
| 2023 | $5,520 | $266,736 | $86,842 | $179,894 |
| 2022 | $5,395 | $261,507 | $85,140 | $176,367 |
| 2021 | $5,367 | $256,380 | $83,471 | $172,909 |
| 2020 | $5,286 | $253,753 | $82,616 | $171,137 |
| 2019 | $5,188 | $248,779 | $80,997 | $167,782 |
| 2018 | $5,052 | $243,902 | $79,409 | $164,493 |
| 2017 | $4,954 | $239,120 | $77,852 | $161,268 |
| 2016 | $4,902 | $234,432 | $76,326 | $158,106 |
| 2015 | $4,804 | $230,912 | $75,180 | $155,732 |
| 2014 | $4,714 | $226,390 | $73,708 | $152,682 |
Source: Public Records
Map
Nearby Homes
- 11794 Dionysus Way
- 11728 Dionysus Way
- 11708 Dionysus Way
- 11816 Spring Walk Way
- 4160 Anatolia Dr
- 11791 Battenburg Way
- 11790 Bagota Way
- 4403 Niobe Cir
- 4291 Sardonyx Way
- 11724 Brook Valley Way
- 11751 Village Pond Way
- 4048 Kalamata Way
- 4163 Aura Way
- 4081 Valance Way
- 11781 Plato Way
- 12086 Mircado Way
- 11786 Socrates Way
- 4253 Privas Way
- 11708 Azalea Garden Way
- 4036 Valance Way
- 11744 Arista Way
- 11736 Arista Way
- 11700 Corino Way
- 11748 Arista Way
- 11732 Arista Way
- 11704 Corino Way
- 4280 Thalia Way
- 11708 Corino Way
- 11741 Arista Way
- 11745 Arista Way
- 11737 Arista Way
- 4276 Thalia Way
- 11752 Arista Way
- 11728 Arista Way
- 11749 Arista Way
- 11733 Arista Way
- 11712 Corino Way
- 4272 Thalia Way
- 11753 Arista Way
- 11729 Arista Way