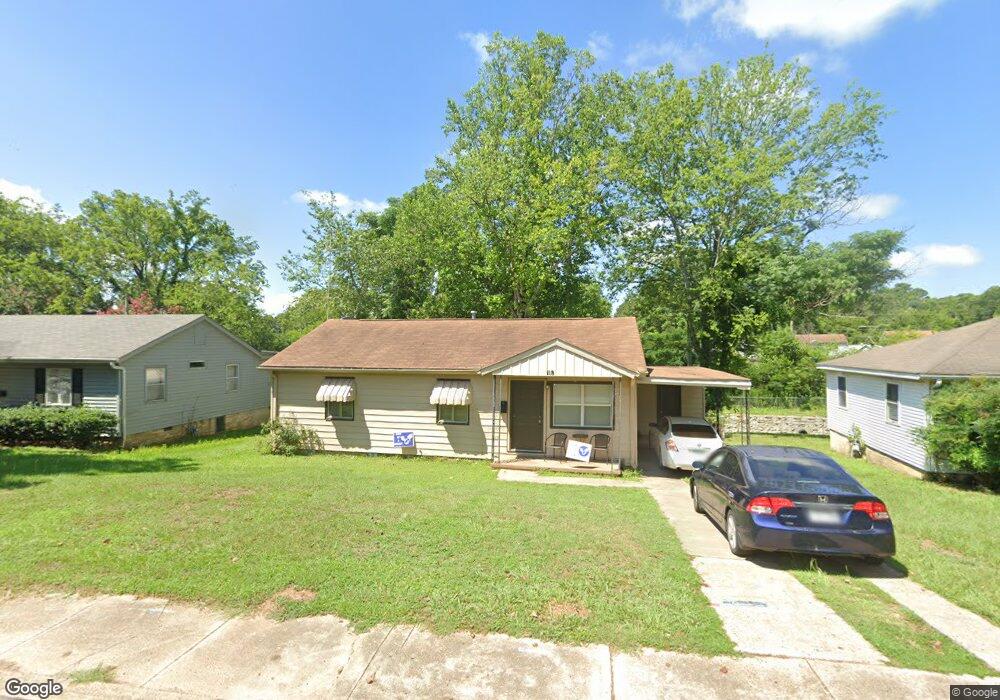
118 Border Cir Benton, AR 72015
Estimated Value: $124,014 - $149,000
Studio
1
Bath
1,406
Sq Ft
$100/Sq Ft
Est. Value
About This Home
This home is located at 118 Border Cir, Benton, AR 72015 and is currently estimated at $140,504, approximately $99 per square foot. 118 Border Cir is a home located in Saline County with nearby schools including Angie Grant Elementary School, Benton Middle School, and Benton Junior High School.
Ownership History
Date
Name
Owned For
Owner Type
Purchase Details
Closed on
Oct 18, 2018
Sold by
Castle Investments Llc
Bought by
City Of Benton
Current Estimated Value
Purchase Details
Closed on
Mar 31, 2005
Sold by
Tucker Richard Alan and Tucker Susan W
Bought by
Castle Investments Llc
Home Financials for this Owner
Home Financials are based on the most recent Mortgage that was taken out on this home.
Original Mortgage
$55,000
Interest Rate
5%
Mortgage Type
Construction
Purchase Details
Closed on
Feb 1, 1991
Bought by
Tucker
Purchase Details
Closed on
Aug 1, 1990
Bought by
Johnson and Southerland
Create a Home Valuation Report for This Property
The Home Valuation Report is an in-depth analysis detailing your home's value as well as a comparison with similar homes in the area
Home Values in the Area
Average Home Value in this Area
Purchase History
| Date | Buyer | Sale Price | Title Company |
|---|---|---|---|
| City Of Benton | -- | None Available | |
| Castle Investments Llc | $54,000 | -- | |
| Tucker | $32,000 | -- | |
| Johnson | -- | -- |
Source: Public Records
Mortgage History
| Date | Status | Borrower | Loan Amount |
|---|---|---|---|
| Previous Owner | Castle Investments Llc | $55,000 |
Source: Public Records
Tax History
| Year | Tax Paid | Tax Assessment Tax Assessment Total Assessment is a certain percentage of the fair market value that is determined by local assessors to be the total taxable value of land and additions on the property. | Land | Improvement |
|---|---|---|---|---|
| 2025 | $844 | $15,232 | $2,760 | $12,472 |
| 2024 | $864 | $15,232 | $2,760 | $12,472 |
| 2023 | $844 | $15,232 | $2,760 | $12,472 |
| 2022 | $844 | $15,232 | $2,760 | $12,472 |
| 2021 | $768 | $13,860 | $2,300 | $11,560 |
| 2020 | $768 | $13,860 | $2,300 | $11,560 |
| 2019 | $768 | $13,860 | $2,300 | $11,560 |
| 2018 | $766 | $13,860 | $2,300 | $11,560 |
| 2017 | $766 | $13,860 | $2,300 | $11,560 |
| 2016 | $1,034 | $18,240 | $2,300 | $15,940 |
| 2015 | $1,023 | $18,240 | $2,300 | $15,940 |
| 2014 | $1,023 | $18,240 | $2,300 | $15,940 |
Source: Public Records
Map
Nearby Homes
Your Personal Tour Guide
Ask me questions while you tour the home.