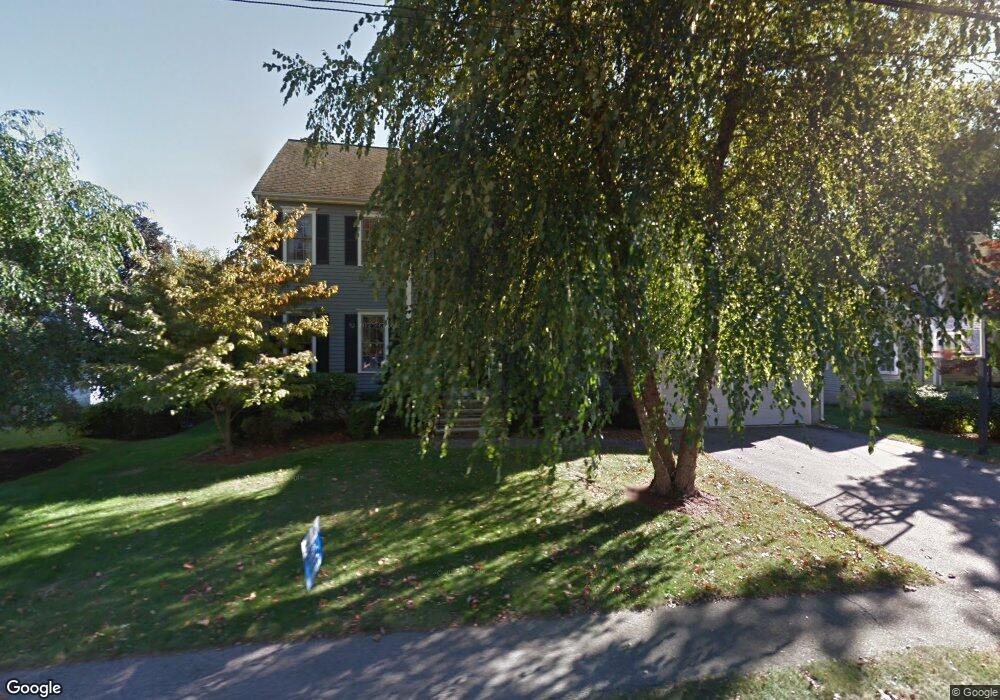
118 Highgate St Needham, MA 02492
Estimated Value: $1,629,000 - $2,113,000
4
Beds
3
Baths
3,313
Sq Ft
$572/Sq Ft
Est. Value
About This Home
This home is located at 118 Highgate St, Needham, MA 02492 and is currently estimated at $1,893,850, approximately $571 per square foot. 118 Highgate St is a home located in Norfolk County with nearby schools including Broadmeadow Elementary School, High Rock Middle School, and Pollard Middle School.
Ownership History
Date
Name
Owned For
Owner Type
Purchase Details
Closed on
Mar 27, 2025
Sold by
Sullivan Brian S and Sullivan Kristine
Bought by
Brian S Sullivan 2025 Ret and Sullivan
Current Estimated Value
Purchase Details
Closed on
Jul 25, 2006
Sold by
Cranna Bruce and Cranna Jill I
Bought by
Sullivan Brian S and Sullivan Kristine
Purchase Details
Closed on
May 28, 1999
Sold by
Piersiak William J
Bought by
Cranna Bruce and Cranna Jill I
Purchase Details
Closed on
Sep 4, 1998
Sold by
Jacques Steven N and Jacques Katherine P
Bought by
Piersak William J
Purchase Details
Closed on
Dec 1, 1994
Sold by
Est Boland Arthur J and Boland Frances
Bought by
Jacques Steven N and Jacques Katherine P
Create a Home Valuation Report for This Property
The Home Valuation Report is an in-depth analysis detailing your home's value as well as a comparison with similar homes in the area
Home Values in the Area
Average Home Value in this Area
Purchase History
| Date | Buyer | Sale Price | Title Company |
|---|---|---|---|
| Brian S Sullivan 2025 Ret | -- | None Available | |
| Brian S Sullivan 2025 Ret | -- | None Available | |
| Sullivan Brian S | $1,200,000 | -- | |
| Sullivan Brian S | $1,200,000 | -- | |
| Cranna Bruce | $649,000 | -- | |
| Piersak William J | $275,000 | -- | |
| Piersak William J | $275,000 | -- | |
| Jacques Steven N | $170,000 | -- | |
| Jacques Steven N | $170,000 | -- |
Source: Public Records
Mortgage History
| Date | Status | Borrower | Loan Amount |
|---|---|---|---|
| Previous Owner | Jacques Steven N | $375,000 | |
| Previous Owner | Jacques Steven N | $385,000 |
Source: Public Records
Tax History
| Year | Tax Paid | Tax Assessment Tax Assessment Total Assessment is a certain percentage of the fair market value that is determined by local assessors to be the total taxable value of land and additions on the property. | Land | Improvement |
|---|---|---|---|---|
| 2025 | $15,798 | $1,490,400 | $800,400 | $690,000 |
| 2024 | $18,612 | $1,486,600 | $589,200 | $897,400 |
| 2023 | $18,474 | $1,416,700 | $589,200 | $827,500 |
| 2022 | $17,444 | $1,304,700 | $521,400 | $783,300 |
| 2021 | $17,000 | $1,304,700 | $521,400 | $783,300 |
| 2020 | $15,985 | $1,279,800 | $521,400 | $758,400 |
| 2019 | $15,053 | $1,214,900 | $474,000 | $740,900 |
| 2018 | $14,420 | $1,213,800 | $474,000 | $739,800 |
| 2017 | $14,610 | $1,228,800 | $474,000 | $754,800 |
| 2016 | $14,180 | $1,228,800 | $474,000 | $754,800 |
Source: Public Records
Map
Nearby Homes
- 168 Richdale Rd
- 883 Greendale Ave
- 26 Pinewood Rd
- 40 Otis St Unit L
- 638 Webster St
- 638 Webster St Unit 638
- 26 Gordon Rd
- 143 Hunting Rd
- 40 High St
- 97 Great Plain Ave
- 19 Highland Ct Unit 19
- 7 West St
- 1011 Webster St
- 5 Hazel Ln
- 68 Pleasant St Unit 68
- 233 Warren St
- 108 Woodbine Cir
- 242 Valley Rd
- 1202 Greendale Ave Unit 133
- 1206 Greendale Ave Unit 201
Your Personal Tour Guide
Ask me questions while you tour the home.