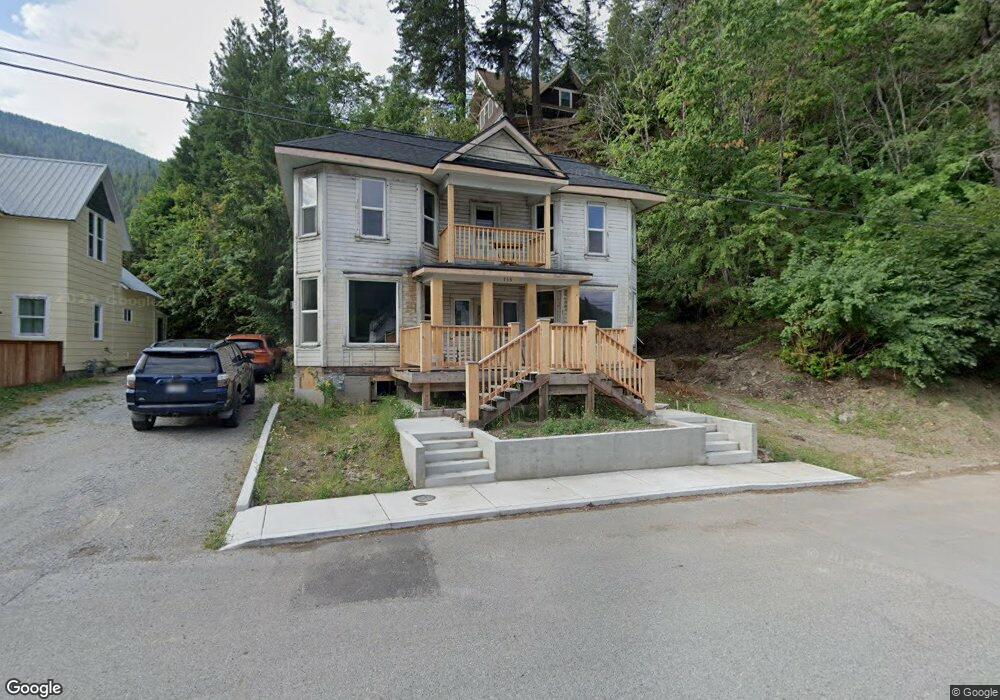
118 River St Wallace, ID 83873
Estimated Value: $283,753 - $331,000
3
Beds
2
Baths
1,358
Sq Ft
$225/Sq Ft
Est. Value
About This Home
This home is located at 118 River St, Wallace, ID 83873 and is currently estimated at $305,188, approximately $224 per square foot. 118 River St is a home with nearby schools including Silver Hills Elementary School and Wallace Junior/Senior High School.
Ownership History
Date
Name
Owned For
Owner Type
Purchase Details
Closed on
Sep 20, 2019
Sold by
Jung Jaymi D
Bought by
Manteraux Holdings Llc
Current Estimated Value
Purchase Details
Closed on
Jun 16, 2017
Sold by
Jung Jaymi D
Bought by
Manteraux Holdings Llc
Home Financials for this Owner
Home Financials are based on the most recent Mortgage that was taken out on this home.
Original Mortgage
$18,205
Interest Rate
3.99%
Create a Home Valuation Report for This Property
The Home Valuation Report is an in-depth analysis detailing your home's value as well as a comparison with similar homes in the area
Purchase History
| Date | Buyer | Sale Price | Title Company |
|---|---|---|---|
| Manteraux Holdings Llc | -- | None Available | |
| Manteraux Holdings Llc | $25,000 | None Available | |
| Manteraux Holdings Llc | $25,000 | None Available |
Source: Public Records
Mortgage History
| Date | Status | Borrower | Loan Amount |
|---|---|---|---|
| Previous Owner | Manteraux Holdings Llc | $18,205 |
Source: Public Records
Tax History
| Year | Tax Paid | Tax Assessment Tax Assessment Total Assessment is a certain percentage of the fair market value that is determined by local assessors to be the total taxable value of land and additions on the property. | Land | Improvement |
|---|---|---|---|---|
| 2025 | $2,441 | $311,558 | $23,894 | $287,664 |
| 2024 | $2,470 | $311,558 | $23,894 | $287,664 |
| 2023 | $2,470 | $314,795 | $23,894 | $290,901 |
| 2022 | $2,553 | $234,779 | $11,006 | $223,773 |
| 2021 | $3,315 | $123,045 | $9,465 | $113,580 |
| 2020 | $2,073 | $57,549 | $8,969 | $48,580 |
| 2019 | $1,961 | $57,798 | $7,218 | $50,580 |
| 2018 | $1,779 | $47,422 | $6,562 | $40,860 |
| 2017 | $1,506 | $43,532 | $6,562 | $36,970 |
| 2016 | $1,394 | $38,642 | $6,562 | $32,080 |
| 2015 | $1,822 | $56,350 | $6,562 | $49,788 |
| 2014 | $1,336 | $44,821 | $6,562 | $38,259 |
Source: Public Records
Map
Nearby Homes
- 303 3rd St
- 214 Cypress St
- 409 Pine St
- 504 1st St
- 312 High Bank St
- 307 Elm St
- 408 High Bank St
- 1 Kelly Aly
- 620 Pearl St
- 176 King St
- 191 King St
- 920 Pearl St
- NNN Burke Rd
- 741 9 Mile Creek Rd
- 62713 Benthams Rd
- 109 Railroad Ave
- 498 Revenue Gulch Rd
- 1151 E Fir
- 603 E Larch Ave
- 1600 W Yellowstone Ave Unit 45
Your Personal Tour Guide
Ask me questions while you tour the home.