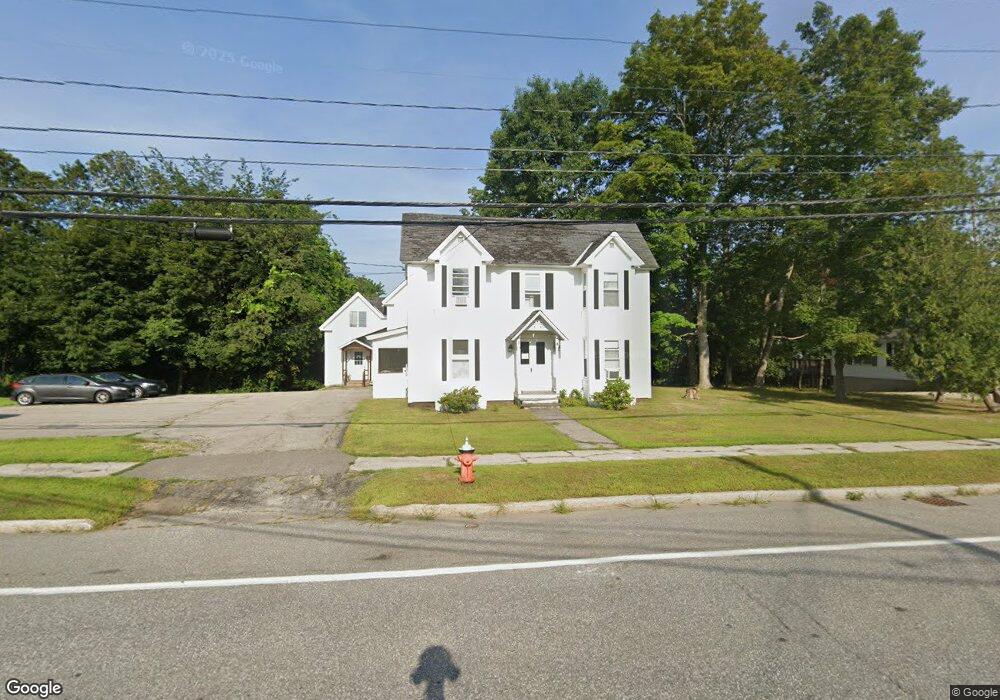
118 South St Concord, NH 03301
South End NeighborhoodEstimated Value: $512,760 - $573,000
4
Beds
2
Baths
2,926
Sq Ft
$183/Sq Ft
Est. Value
About This Home
This home is located at 118 South St, Concord, NH 03301 and is currently estimated at $535,190, approximately $182 per square foot. 118 South St is a home located in Merrimack County with nearby schools including Abbot-Downing School, Rundlett Middle School, and Concord High School.
Ownership History
Date
Name
Owned For
Owner Type
Purchase Details
Closed on
Dec 30, 2003
Sold by
Hoyt David C
Bought by
Mills Ernest S and Mills Lisa C
Current Estimated Value
Home Financials for this Owner
Home Financials are based on the most recent Mortgage that was taken out on this home.
Original Mortgage
$189,600
Outstanding Balance
$86,562
Interest Rate
6.01%
Mortgage Type
Purchase Money Mortgage
Estimated Equity
$448,628
Create a Home Valuation Report for This Property
The Home Valuation Report is an in-depth analysis detailing your home's value as well as a comparison with similar homes in the area
Home Values in the Area
Average Home Value in this Area
Purchase History
| Date | Buyer | Sale Price | Title Company |
|---|---|---|---|
| Mills Ernest S | $237,000 | -- |
Source: Public Records
Mortgage History
| Date | Status | Borrower | Loan Amount |
|---|---|---|---|
| Open | Mills Ernest S | $189,600 |
Source: Public Records
Tax History
| Year | Tax Paid | Tax Assessment Tax Assessment Total Assessment is a certain percentage of the fair market value that is determined by local assessors to be the total taxable value of land and additions on the property. | Land | Improvement |
|---|---|---|---|---|
| 2025 | $9,283 | $318,900 | $116,500 | $202,400 |
| 2024 | $8,830 | $318,900 | $116,500 | $202,400 |
| 2023 | $8,566 | $318,900 | $116,500 | $202,400 |
| 2022 | $8,256 | $318,900 | $116,500 | $202,400 |
| 2021 | $8,011 | $318,900 | $116,500 | $202,400 |
| 2020 | $10,665 | $278,800 | $92,900 | $185,900 |
| 2019 | $10,210 | $258,900 | $91,300 | $167,600 |
| 2018 | $7,293 | $258,700 | $91,300 | $167,400 |
| 2017 | $7,263 | $257,200 | $91,300 | $165,900 |
| 2016 | $6,591 | $238,200 | $90,800 | $147,400 |
| 2015 | $5,968 | $218,300 | $94,600 | $123,700 |
| 2014 | $5,853 | $218,300 | $94,600 | $123,700 |
| 2013 | $5,321 | $208,000 | $94,600 | $113,400 |
| 2012 | $5,435 | $223,000 | $94,600 | $128,400 |
Source: Public Records
Map
Nearby Homes
- 20 Carter St
- 0 South St Unit 4969509
- 1 Matthew St Unit 6
- 47 South St
- 5 Broad Ave
- 58 S State St
- 7-9 Myrtle St
- 289 South St
- 24 Hazel Dr
- 30 Longmeadow Dr
- 7 Highridge Trail
- 55 Tremont St
- 22 Fairfield Dr
- 157 Rumford St
- 19 Grappone Dr
- 28 Stevens Dr
- 30 Penacook St
- 107 Garvins Falls Rd
- 20 Grandview Rd
- 5 Ormond St
Your Personal Tour Guide
Ask me questions while you tour the home.