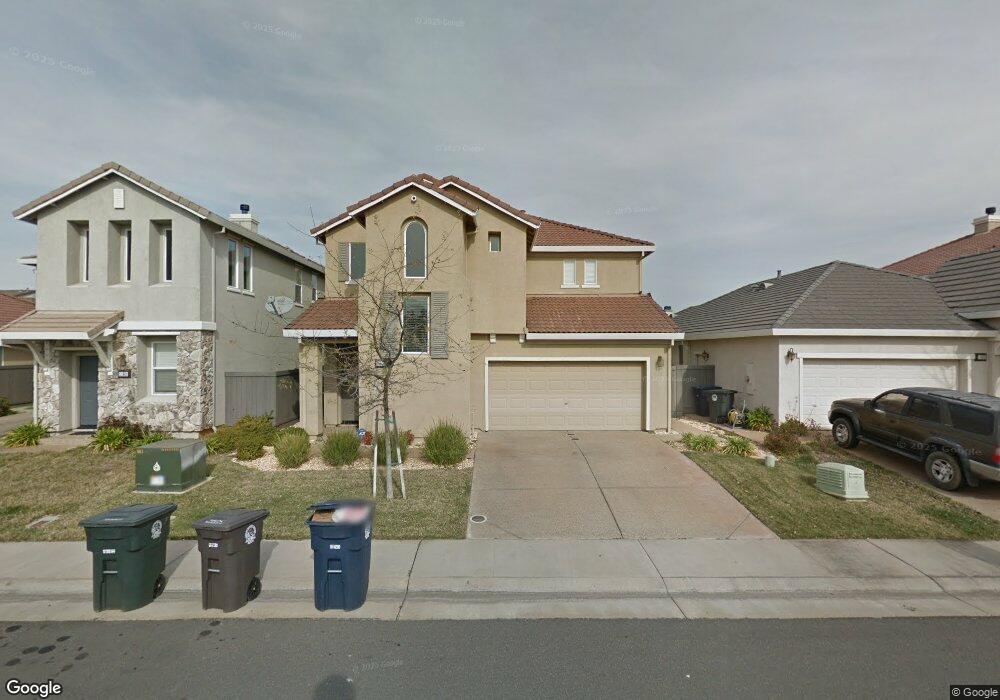
11805 Loisdale Way Rancho Cordova, CA 95742
Anatolia NeighborhoodEstimated Value: $443,000 - $624,627
4
Beds
3
Baths
2,375
Sq Ft
$237/Sq Ft
Est. Value
About This Home
This home is located at 11805 Loisdale Way, Rancho Cordova, CA 95742 and is currently estimated at $562,907, approximately $237 per square foot. 11805 Loisdale Way is a home located in Sacramento County with nearby schools including Sunrise Elementary School, Katherine L. Albiani Middle School, and Pleasant Grove High School.
Ownership History
Date
Name
Owned For
Owner Type
Purchase Details
Closed on
Jun 18, 2013
Sold by
Vegi Rohini A and Villuri Srinivasa R
Bought by
Villuri Srinivasa R and Vegi Rohini A
Current Estimated Value
Home Financials for this Owner
Home Financials are based on the most recent Mortgage that was taken out on this home.
Original Mortgage
$290,000
Outstanding Balance
$205,275
Interest Rate
3.38%
Mortgage Type
New Conventional
Estimated Equity
$357,632
Purchase Details
Closed on
Aug 18, 2005
Sold by
Us Home Corp
Bought by
Vegi Rohini A and Villuri Srinivasa R
Home Financials for this Owner
Home Financials are based on the most recent Mortgage that was taken out on this home.
Original Mortgage
$345,450
Interest Rate
5.12%
Mortgage Type
Purchase Money Mortgage
Purchase Details
Closed on
Dec 8, 2004
Sold by
Gmac Model Home Finance Inc
Bought by
Us Home Corp
Create a Home Valuation Report for This Property
The Home Valuation Report is an in-depth analysis detailing your home's value as well as a comparison with similar homes in the area
Home Values in the Area
Average Home Value in this Area
Purchase History
| Date | Buyer | Sale Price | Title Company |
|---|---|---|---|
| Villuri Srinivasa R | -- | First American Title Company | |
| Vegi Rohini A | $432,000 | North American Title Co | |
| Us Home Corp | -- | North American Title Co |
Source: Public Records
Mortgage History
| Date | Status | Borrower | Loan Amount |
|---|---|---|---|
| Open | Villuri Srinivasa R | $290,000 | |
| Closed | Vegi Rohini A | $345,450 |
Source: Public Records
Tax History Compared to Growth
Tax History
| Year | Tax Paid | Tax Assessment Tax Assessment Total Assessment is a certain percentage of the fair market value that is determined by local assessors to be the total taxable value of land and additions on the property. | Land | Improvement |
|---|---|---|---|---|
| 2025 | $8,764 | $590,130 | $102,483 | $487,647 |
| 2024 | $8,764 | $578,560 | $100,474 | $478,086 |
| 2023 | $8,542 | $567,216 | $98,504 | $468,712 |
| 2022 | $8,472 | $556,095 | $96,573 | $459,522 |
| 2021 | $7,536 | $473,789 | $82,279 | $391,510 |
| 2020 | $6,821 | $411,991 | $71,547 | $340,444 |
| 2019 | $6,532 | $388,672 | $67,498 | $321,174 |
| 2018 | $6,280 | $373,724 | $64,902 | $308,822 |
| 2017 | $5,946 | $346,042 | $60,095 | $285,947 |
| 2016 | $5,695 | $326,456 | $56,694 | $269,762 |
| 2015 | $5,445 | $307,978 | $53,485 | $254,493 |
| 2014 | $5,186 | $293,312 | $50,938 | $242,374 |
Source: Public Records
Map
Nearby Homes
- 11724 Brook Valley Way
- 11751 Village Pond Way
- 11790 Bagota Way
- 11791 Battenburg Way
- 11708 Dionysus Way
- 4160 Anatolia Dr
- 11728 Dionysus Way
- 4048 Kalamata Way
- 11781 Plato Way
- 11794 Dionysus Way
- 11816 Spring Walk Way
- 11786 Socrates Way
- 3930 Riley Anton Way
- 4081 Valance Way
- 4036 Valance Way
- 3063 Banano Way
- 11918 Herodian Dr
- 11926 Herodian Dr
- 11962 Granzella Way
- Plan 1 at Montelena - Vista
- 11809 Loisdale Way
- 11801 Loisdale Way
- 11813 Loisdale Way
- 11797 Loisdale Way
- 11776 Brook Valley Way
- 11780 Brook Valley Way
- 11772 Brook Valley Way
- 11817 Loisdale Way
- 11793 Loisdale Way
- 11784 Brook Valley Way
- 11768 Brook Valley Way
- 11804 Loisdale Way
- 11808 Loisdale Way
- 11812 Loisdale Way
- 11821 Loisdale Way
- 11789 Loisdale Way
- 11792 Loisdale Way
- 11788 Brook Valley Way
- 11816 Loisdale Way
- 11764 Brook Valley Way