

$585,900
- 4 Beds
- 2 Baths
- 1,794 Sq Ft
- 5321 Otter Pond Way
- Rancho Cordova, CA
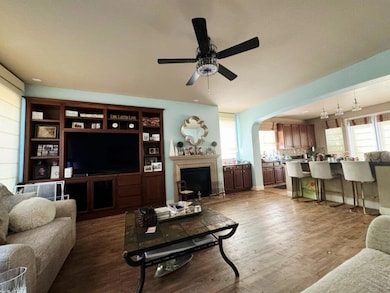
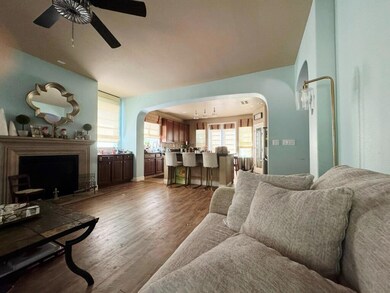
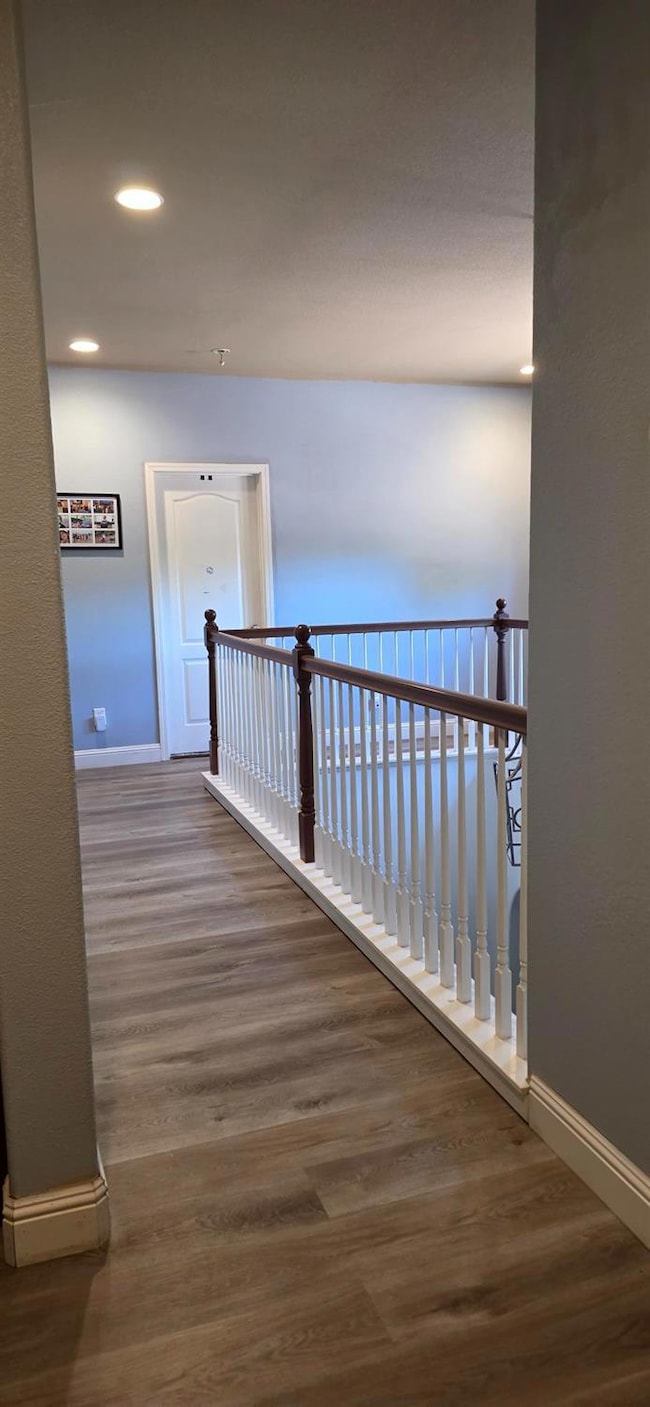
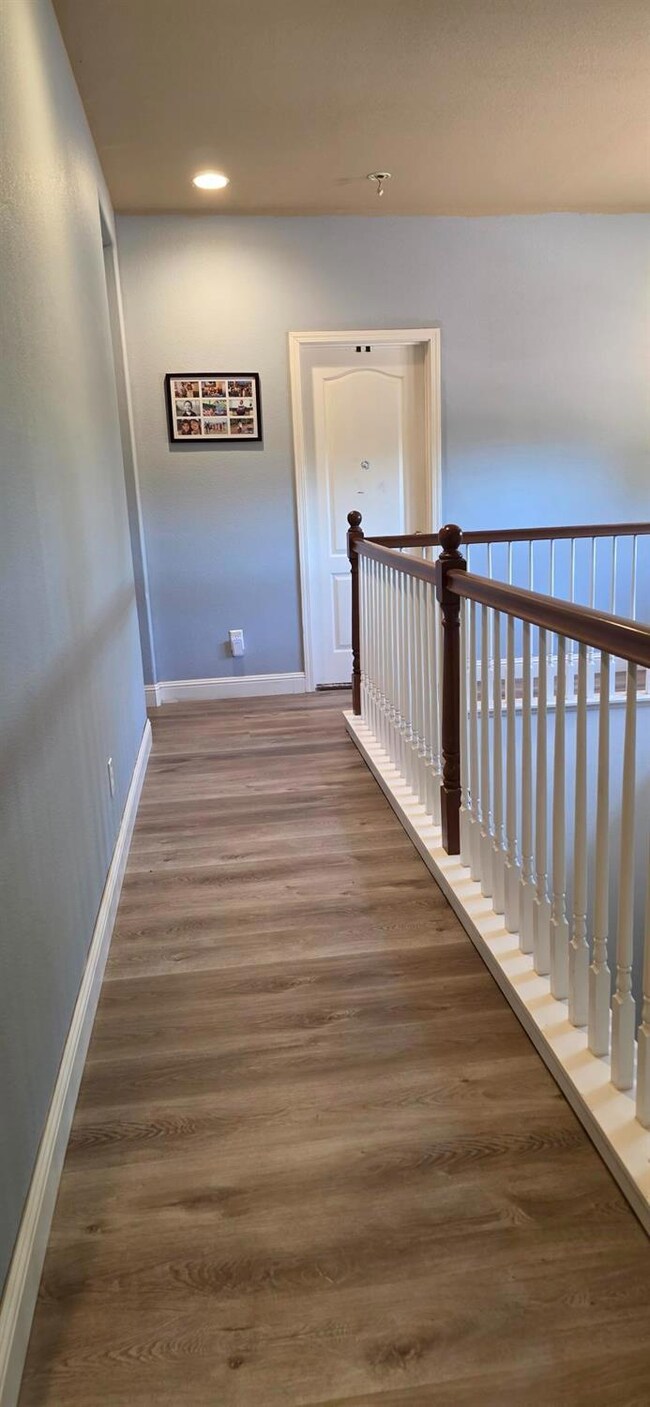
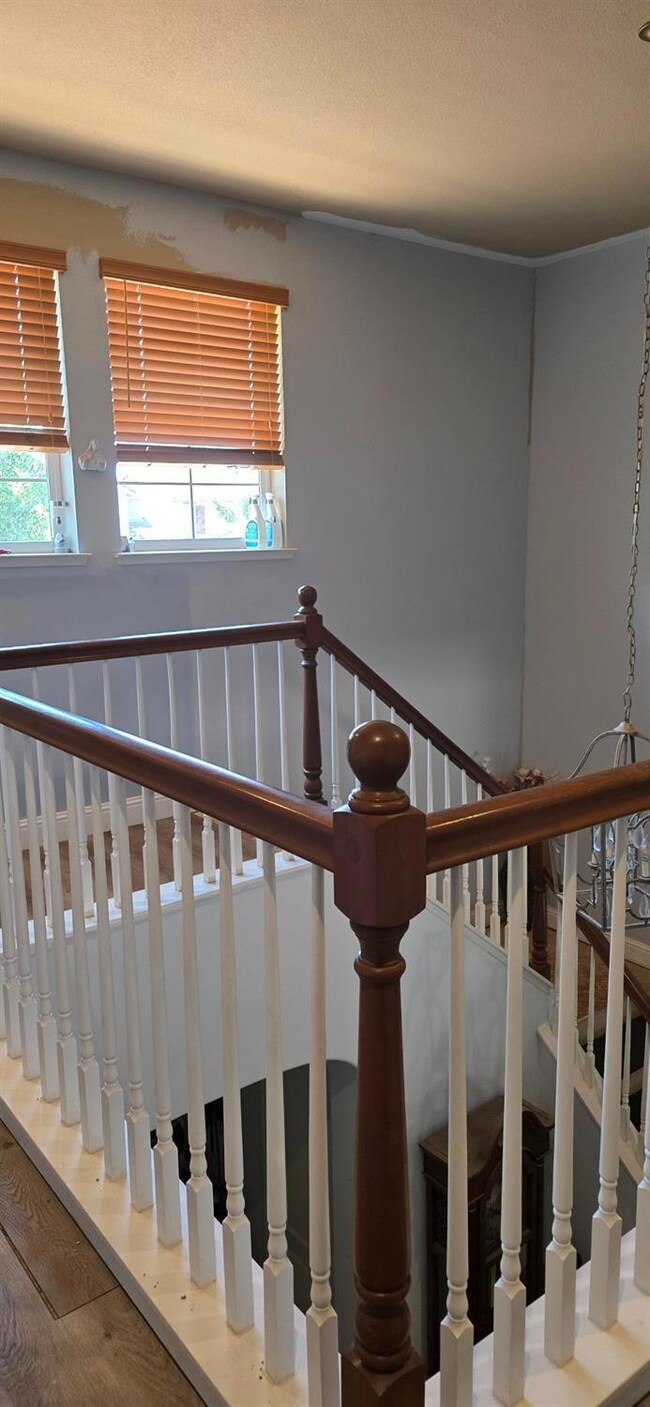
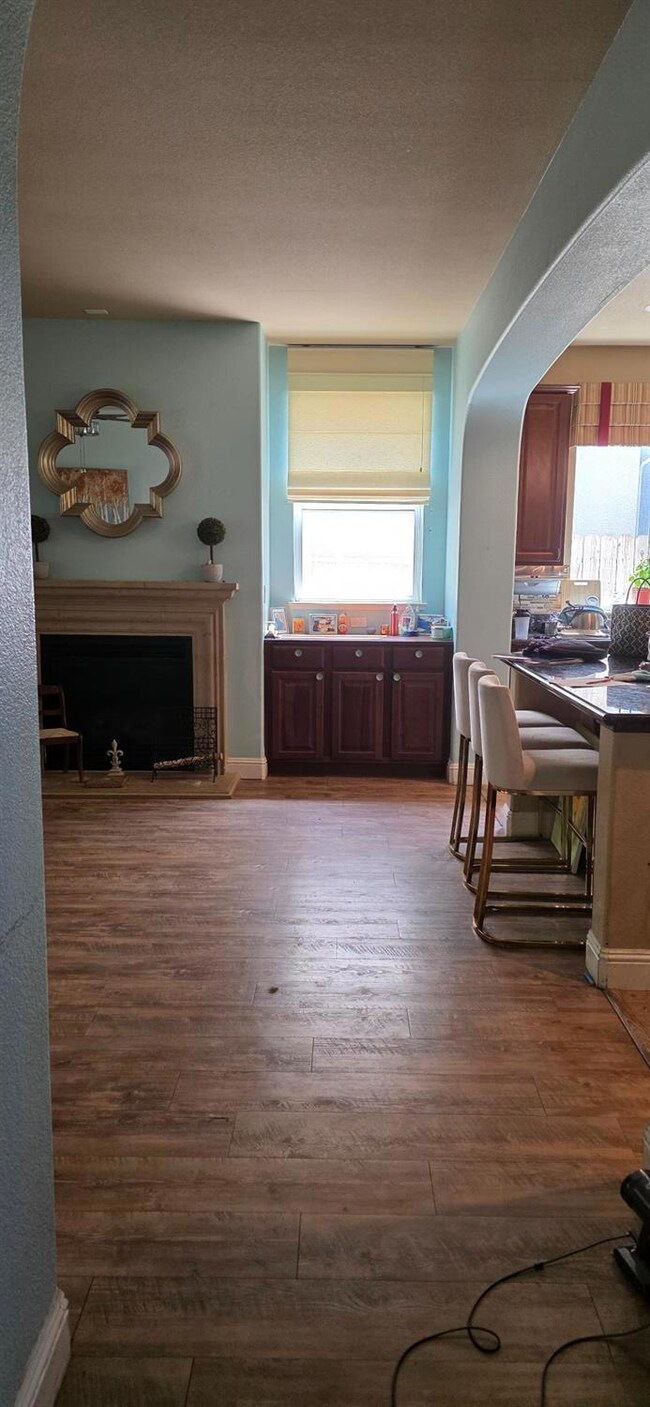
Welcome to this beautiful home in the desirable Kavala Ranch community of Rancho Cordova. Inside, you'll find an open concept with a spacious kitchen, large island and granite countertops. The home also features laminate flooring, tile flooring in wet areas, all weather vinyl shutters in the master and living areas, a laundry room, and a 2-car garage. The home is equipped with owned solar panels,
Johnny Stockert Sterling Royal Real Estate