11828 Blushing Cir Rancho Cordova, CA 95742
Anatolia NeighborhoodEstimated Value: $542,000 - $872,000
5
Beds
4
Baths
4,235
Sq Ft
$181/Sq Ft
Est. Value
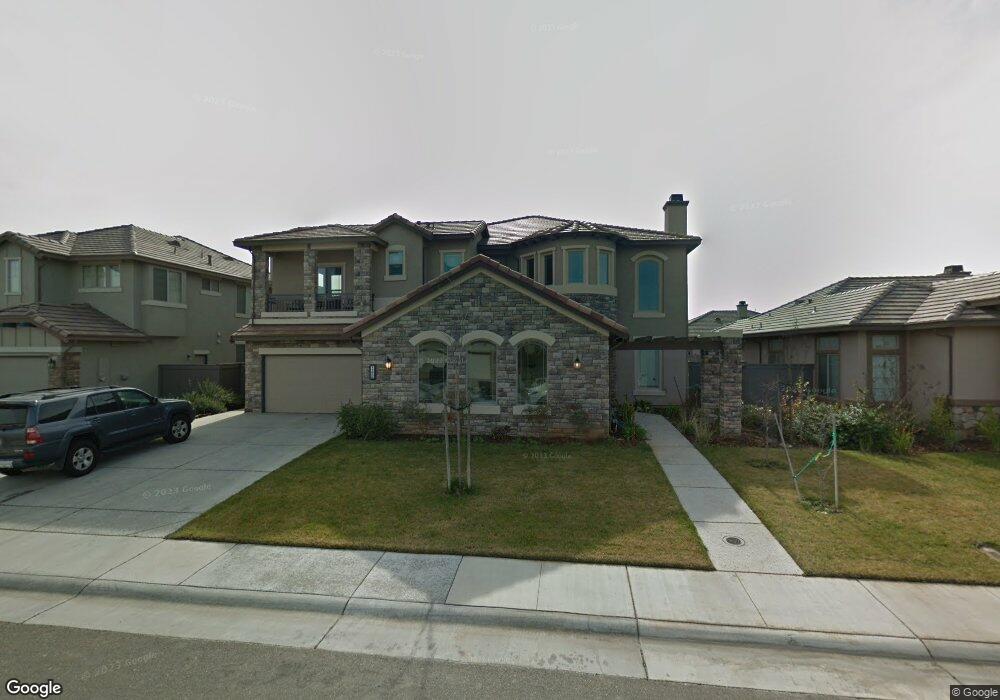
About This Home
This home is located at 11828 Blushing Cir, Rancho Cordova, CA 95742 and is currently estimated at $768,033, approximately $181 per square foot. 11828 Blushing Cir is a home located in Sacramento County with nearby schools including Robert J. McGarvey Elementary, Katherine L. Albiani Middle School, and Pleasant Grove High School.
Ownership History
Date
Name
Owned For
Owner Type
Purchase Details
Closed on
Nov 5, 2015
Sold by
Pagador Hoang Quan M and Pagador Hoang Bernadette
Bought by
Pagador Hoang Quan M and Pagador Hoang Bernadette
Current Estimated Value
Home Financials for this Owner
Home Financials are based on the most recent Mortgage that was taken out on this home.
Original Mortgage
$350,900
Outstanding Balance
$143,935
Interest Rate
3.8%
Mortgage Type
New Conventional
Estimated Equity
$624,098
Purchase Details
Closed on
Nov 18, 2008
Sold by
Hoang Quan and Pagador Bernadette M
Bought by
Hoang Quan M and Pagador Bernadette M
Home Financials for this Owner
Home Financials are based on the most recent Mortgage that was taken out on this home.
Original Mortgage
$404,991
Interest Rate
5.9%
Mortgage Type
Purchase Money Mortgage
Create a Home Valuation Report for This Property
The Home Valuation Report is an in-depth analysis detailing your home's value as well as a comparison with similar homes in the area
Home Values in the Area
Average Home Value in this Area
Purchase History
| Date | Buyer | Sale Price | Title Company |
|---|---|---|---|
| Pagador Hoang Quan M | -- | None Available | |
| Hoang Quan M | -- | None Available | |
| Hoang Quan | $450,000 | Placer Title Company |
Source: Public Records
Mortgage History
| Date | Status | Borrower | Loan Amount |
|---|---|---|---|
| Open | Pagador Hoang Quan M | $350,900 | |
| Closed | Hoang Quan | $404,991 |
Source: Public Records
Tax History Compared to Growth
Tax History
| Year | Tax Paid | Tax Assessment Tax Assessment Total Assessment is a certain percentage of the fair market value that is determined by local assessors to be the total taxable value of land and additions on the property. | Land | Improvement |
|---|---|---|---|---|
| 2025 | $8,908 | $579,465 | $193,156 | $386,309 |
| 2024 | $8,908 | $568,104 | $189,369 | $378,735 |
| 2023 | $8,684 | $556,965 | $185,656 | $371,309 |
| 2022 | $8,503 | $546,045 | $182,016 | $364,029 |
| 2021 | $8,446 | $535,340 | $178,448 | $356,892 |
| 2020 | $8,321 | $529,852 | $176,619 | $353,233 |
| 2019 | $8,165 | $519,463 | $173,156 | $346,307 |
| 2018 | $7,946 | $509,278 | $169,761 | $339,517 |
| 2017 | $7,796 | $499,293 | $166,433 | $332,860 |
| 2016 | $7,608 | $489,504 | $163,170 | $326,334 |
| 2015 | $7,386 | $482,153 | $160,720 | $321,433 |
| 2014 | $7,249 | $472,709 | $157,572 | $315,137 |
Source: Public Records
Map
Nearby Homes
- 4364 Anatolia Dr
- 4403 Niobe Cir
- 11708 Azalea Garden Way
- 4291 Sardonyx Way
- 4163 Aura Way
- 4389 Kilroy Ct
- 4308 Hartland Way
- 4253 Privas Way
- 11816 Spring Walk Way
- 12042 Mircado Way
- 12086 Mircado Way
- 4239 Parnassus Dr
- Plan 3 at Montelena - Starblossom
- Plan 2 at Montelena - Starblossom
- Plan 1 at Montelena - Starblossom
- Plan 4 at Montelena - Starblossom
- 4160 Anatolia Dr
- 11728 Dionysus Way
- 11708 Dionysus Way
- 12011 Quail Falls Way
- 11832 Blushing Cir
- 11824 Blushing Cir
- 11890 Delavan Cir
- 11886 Delavan Cir
- 11836 Blushing Cir
- 11894 Delavan Cir
- 11820 Blushing Cir
- 11833 Blushing Cir
- 11829 Blushing Cir
- 11882 Delavan Cir
- 11837 Blushing Cir
- 11898 Delavan Cir
- 4399 Malana Way
- 11840 Blushing Cir
- 11841 Blushing Cir
- 11878 Delavan Cir
- 4395 Malana Way
- 11891 Delavan Cir
- 4367 Malana Way
- 4371 Malana Way