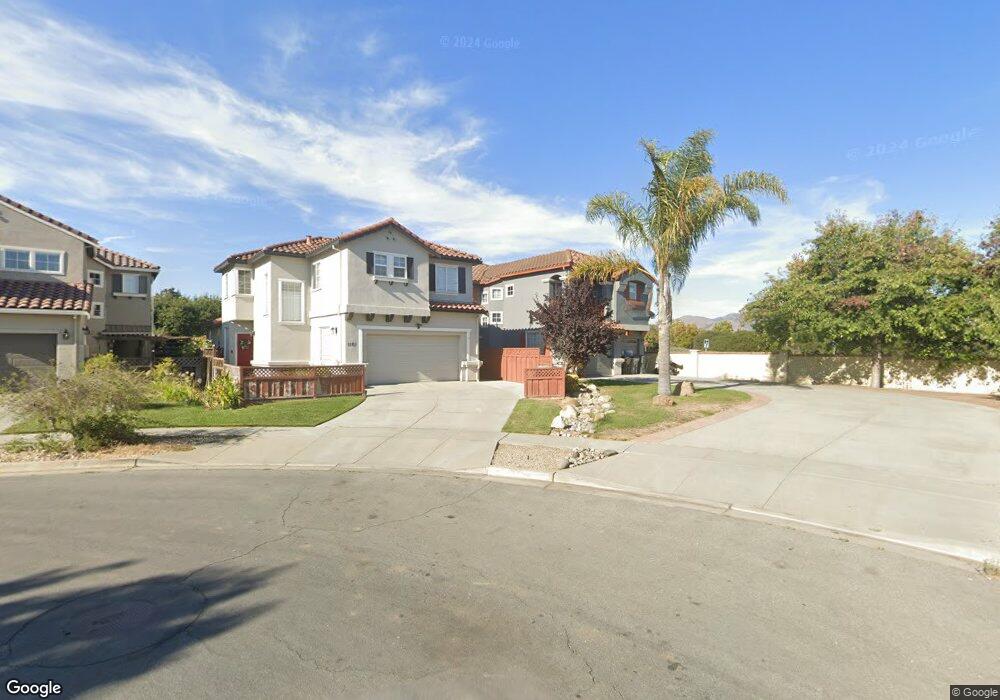
1183 Cobblestone St Salinas, CA 93905
Creekbridge NeighborhoodEstimated Value: $806,755 - $931,000
4
Beds
3
Baths
1,921
Sq Ft
$438/Sq Ft
Est. Value
About This Home
This home is located at 1183 Cobblestone St, Salinas, CA 93905 and is currently estimated at $842,189, approximately $438 per square foot. 1183 Cobblestone St is a home located in Monterey County with nearby schools including Creekside Elementary School, Harden Middle School, and Alisal High School.
Ownership History
Date
Name
Owned For
Owner Type
Purchase Details
Closed on
Dec 20, 2010
Sold by
Wells Fargo Bank Na
Bought by
Smith James Michael
Current Estimated Value
Home Financials for this Owner
Home Financials are based on the most recent Mortgage that was taken out on this home.
Original Mortgage
$242,910
Outstanding Balance
$163,721
Interest Rate
4.62%
Mortgage Type
VA
Estimated Equity
$678,468
Purchase Details
Closed on
Sep 11, 2010
Sold by
Vu Steve Hoang and Pham Thu Ngan Thi
Bought by
Wells Fargo Bank Na
Purchase Details
Closed on
Apr 15, 2006
Sold by
Vu Steve Hoang
Bought by
Vu Steve Hoang and Pham Thu Ngan Thi
Purchase Details
Closed on
May 16, 2001
Sold by
Creekbridge Homes Lp
Bought by
Vu Steve H
Home Financials for this Owner
Home Financials are based on the most recent Mortgage that was taken out on this home.
Original Mortgage
$253,752
Interest Rate
9.45%
Create a Home Valuation Report for This Property
The Home Valuation Report is an in-depth analysis detailing your home's value as well as a comparison with similar homes in the area
Home Values in the Area
Average Home Value in this Area
Purchase History
| Date | Buyer | Sale Price | Title Company |
|---|---|---|---|
| Smith James Michael | $270,000 | Chicago Title Company | |
| Wells Fargo Bank Na | $256,957 | Accommodation | |
| Vu Steve Hoang | -- | None Available | |
| Vu Steve H | $317,500 | Old Republic Title Company |
Source: Public Records
Mortgage History
| Date | Status | Borrower | Loan Amount |
|---|---|---|---|
| Open | Smith James Michael | $242,910 | |
| Previous Owner | Vu Steve H | $253,752 |
Source: Public Records
Tax History
| Year | Tax Paid | Tax Assessment Tax Assessment Total Assessment is a certain percentage of the fair market value that is determined by local assessors to be the total taxable value of land and additions on the property. | Land | Improvement |
|---|---|---|---|---|
| 2025 | $5,440 | $345,775 | $89,675 | $256,100 |
| 2024 | $5,440 | $338,996 | $87,917 | $251,079 |
| 2023 | $5,165 | $332,350 | $86,194 | $246,156 |
| 2022 | $4,160 | $325,834 | $84,504 | $241,330 |
| 2021 | $4,159 | $319,447 | $82,848 | $236,599 |
| 2020 | $4,110 | $316,172 | $81,999 | $234,173 |
| 2019 | $4,235 | $309,974 | $80,392 | $229,582 |
| 2018 | $3,997 | $303,897 | $78,816 | $225,081 |
| 2017 | $4,142 | $297,939 | $77,271 | $220,668 |
| 2016 | $3,932 | $292,098 | $75,756 | $216,342 |
| 2015 | $3,896 | $287,712 | $74,619 | $213,093 |
| 2014 | $3,757 | $282,077 | $73,158 | $208,919 |
Source: Public Records
Map
Nearby Homes
- 1099 Twin Creeks Dr
- 11 Fresa Place
- 18 Hancock Cir
- 1725 Great Island St
- 15 Cheswick Cir
- 1142 Pacific Ave
- 1126 Pacific Ave
- 782 Kilbreth Ave
- 948 Rider Ave
- 1046 C St
- 1910 Whitman St
- 1914 Whitman St
- 1918 Bradbury St
- 980 Longfellow Dr
- 1960 Bradbury St
- 34 Whitman Cir
- 1519 Los Altos Way
- 756 Towt St
- 933 Acosta Plaza Unit 35
- 949 Nantucket Blvd Unit 1
- 1181 Cobblestone St
- 1179 Cobblestone St
- 1178 Cobblestone St
- 1177 Cobblestone St
- 1175 Cobblestone St
- 1176 Cobblestone St
- 1174 Cobblestone St
- 1173 Cobblestone St
- 1172 Cobblestone St
- 1170 Cobblestone St
- 1620 Boston St
- 1622 Boston St
- 1171 Cobblestone St
- 1618 Boston St
- 1624 Boston St
- 1168 Cobblestone St
- 1616 Boston St
- 1626 Boston St
- 1169 Cobblestone St
- 1166 Cobblestone St
Your Personal Tour Guide
Ask me questions while you tour the home.