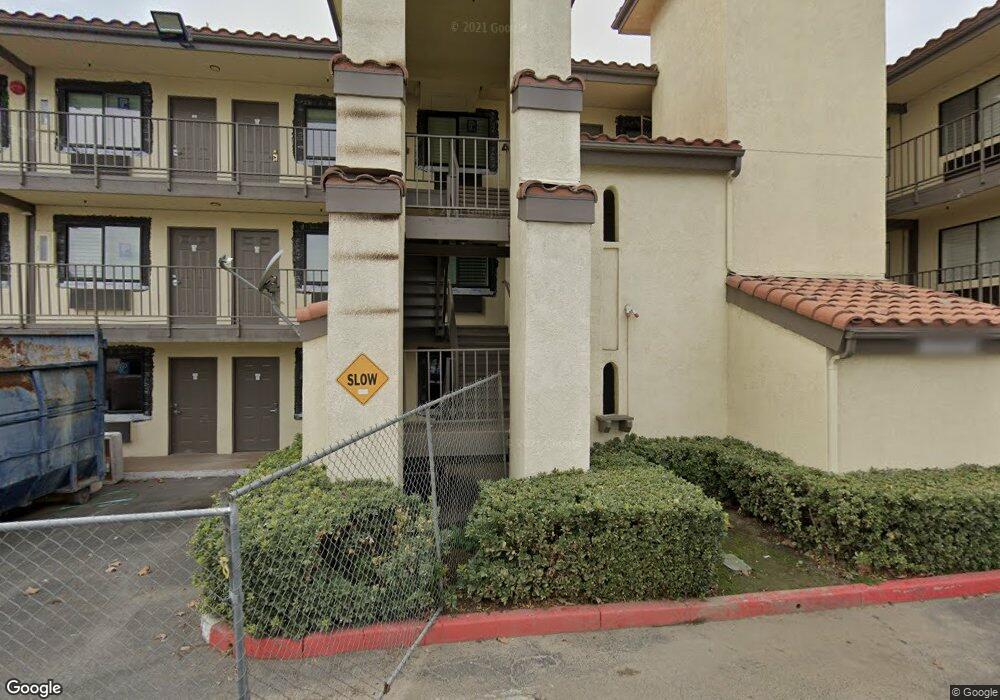
1183 N Blackstone St Tulare, CA 93274
Northeast Tulare Neighborhood
Studio
8280
Baths
27,672
Sq Ft
43,560
Sq Ft Lot
About This Home
This home is located at 1183 N Blackstone St, Tulare, CA 93274. 1183 N Blackstone St is a home located in Tulare County with nearby schools including Garden Elementary School, Cherry Avenue Middle School, and Tulare Western High School.
Ownership History
Date
Name
Owned For
Owner Type
Purchase Details
Closed on
Jan 31, 2020
Sold by
Kaylee & Haley Hospitality Llc
Bought by
Tulare Hospitality Investors Llc
Home Financials for this Owner
Home Financials are based on the most recent Mortgage that was taken out on this home.
Original Mortgage
$5,000,000
Outstanding Balance
$4,417,699
Interest Rate
3.6%
Mortgage Type
Construction
Purchase Details
Closed on
Feb 16, 2017
Sold by
Kabir Californian Llc
Bought by
Kaylee & Haley Hospitality Llc
Home Financials for this Owner
Home Financials are based on the most recent Mortgage that was taken out on this home.
Original Mortgage
$2,920,000
Interest Rate
4.15%
Mortgage Type
Commercial
Purchase Details
Closed on
Mar 6, 2014
Sold by
Oceanic Tulare Lp
Bought by
Kabir Californian Llc
Home Financials for this Owner
Home Financials are based on the most recent Mortgage that was taken out on this home.
Original Mortgage
$1,650,000
Interest Rate
4.29%
Mortgage Type
Commercial
Purchase Details
Closed on
Nov 8, 2011
Sold by
Dit Llc
Bought by
Oceanic Tulare L P
Home Financials for this Owner
Home Financials are based on the most recent Mortgage that was taken out on this home.
Original Mortgage
$1,650,000
Interest Rate
3.87%
Mortgage Type
Commercial
Purchase Details
Closed on
Oct 6, 2011
Sold by
Nirvan Investment Llc
Bought by
Dit Llc
Home Financials for this Owner
Home Financials are based on the most recent Mortgage that was taken out on this home.
Original Mortgage
$1,650,000
Interest Rate
3.87%
Mortgage Type
Commercial
Purchase Details
Closed on
Aug 21, 2007
Sold by
Jd & Young Enterprises Inc
Bought by
Nirvan Investment Llc
Home Financials for this Owner
Home Financials are based on the most recent Mortgage that was taken out on this home.
Original Mortgage
$3,241,000
Interest Rate
6.74%
Mortgage Type
Commercial
Purchase Details
Closed on
Dec 6, 2004
Sold by
Brahma Investment Group Inc
Bought by
Jd & Young Enterprises Inc
Home Financials for this Owner
Home Financials are based on the most recent Mortgage that was taken out on this home.
Original Mortgage
$1,450,000
Interest Rate
5.79%
Mortgage Type
Commercial
Purchase Details
Closed on
Sep 22, 1999
Sold by
Herricks Holdings 1988-1
Bought by
Brahma Investment Group Inc
Home Financials for this Owner
Home Financials are based on the most recent Mortgage that was taken out on this home.
Original Mortgage
$1,451,250
Interest Rate
8.09%
Mortgage Type
Commercial
Create a Home Valuation Report for This Property
The Home Valuation Report is an in-depth analysis detailing your home's value as well as a comparison with similar homes in the area
Home Values in the Area
Average Home Value in this Area
Purchase History
| Date | Buyer | Sale Price | Title Company |
|---|---|---|---|
| Tulare Hospitality Investors Llc | $4,450,000 | Ticor Title Company Of Ca | |
| Kaylee & Haley Hospitality Llc | $3,650,000 | Ticor Title Co Of Ca | |
| Kabir Californian Llc | -- | Wfg National Title Ins Co | |
| Oceanic Tulare L P | $2,200,000 | Fidelity National Title | |
| Dit Llc | $3,400,000 | None Available | |
| Nirvan Investment Llc | $4,780,000 | Chicago Title Co | |
| Jd & Young Enterprises Inc | $3,230,000 | Chicago Title Co | |
| Brahma Investment Group Inc | -- | First American Title Ins Co |
Source: Public Records
Mortgage History
| Date | Status | Borrower | Loan Amount |
|---|---|---|---|
| Open | Tulare Hospitality Investors Llc | $5,000,000 | |
| Previous Owner | Kaylee & Haley Hospitality Llc | $2,920,000 | |
| Previous Owner | Kabir Californian Llc | $1,650,000 | |
| Previous Owner | Oceanic Tulare L P | $1,650,000 | |
| Previous Owner | Nirvan Investment Llc | $3,241,000 | |
| Previous Owner | Jd & Young Enterprises Inc | $1,450,000 | |
| Previous Owner | Brahma Investment Group Inc | $1,451,250 |
Source: Public Records
Tax History
| Year | Tax Paid | Tax Assessment Tax Assessment Total Assessment is a certain percentage of the fair market value that is determined by local assessors to be the total taxable value of land and additions on the property. | Land | Improvement |
|---|---|---|---|---|
| 2025 | $46,650 | $4,285,996 | $692,276 | $3,593,720 |
| 2024 | $46,650 | $4,201,957 | $678,702 | $3,523,255 |
| 2023 | $45,463 | $4,119,567 | $665,395 | $3,454,172 |
| 2022 | $44,136 | $4,038,793 | $652,349 | $3,386,444 |
| 2021 | $43,571 | $3,959,601 | $639,558 | $3,320,043 |
| 2020 | $43,785 | $3,873,409 | $636,725 | $3,236,684 |
| 2019 | $49,613 | $4,197,159 | $624,240 | $3,572,919 |
| 2018 | $48,475 | $4,086,363 | $612,000 | $3,474,363 |
| 2017 | $34,348 | $2,865,318 | $633,747 | $2,231,571 |
| 2016 | $32,571 | $2,785,583 | $621,321 | $2,164,262 |
| 2015 | $28,553 | $2,447,952 | $611,988 | $1,835,964 |
| 2014 | $25,269 | $2,159,382 | $461,084 | $1,698,298 |
Source: Public Records
Map
Nearby Homes
- 1142 N Gem St
- 1113 N Manor Dr
- 1352 N M St
- 445 E Chevy Chase Dr
- 1145 N M St
- 1049 Madrid Ave
- 923 Lisbon Ave
- 939 Lisbon Ave
- 947 Lisbon Ave
- 1842 Berlin Ct
- 273 E Gannon Dr
- 1922 N Adams St
- 1159 Syrah Ct
- 1563 E Glenwood Ave
- 201 E Lois Ave
- 315 E Washington Ave
- 123 E Berkeley Ave
- 1128 N Jefferson St
- 130 E Woodward Dr
- 1582 E Ben Franklin Ave
- 1100 N Cherry St
- 0 N Cherry St Unit 234531
- 0 N Cherry St Unit 35 143138
- 0 N Cherry St Unit 26 143137
- 0 N Cherry St Unit 24 143136
- 0 N Cherry St
- 770 E Prosperity Ave
- 1159 N Cherry St
- 1167 N Cherry St
- 1068 N Cherry St
- 1346 N Cherry Ct
- 1010 E Prosperity Ave
- 1004 E Prosperity Ave
- 1394 Cherry Ct
- 1295 N Cherry St
- 1245 N Cherry St
- 1237 N Cherry St
- 1297 N Cherry St
- 860 E Merritt Ave
- 870 E Merritt Ave
Your Personal Tour Guide
Ask me questions while you tour the home.