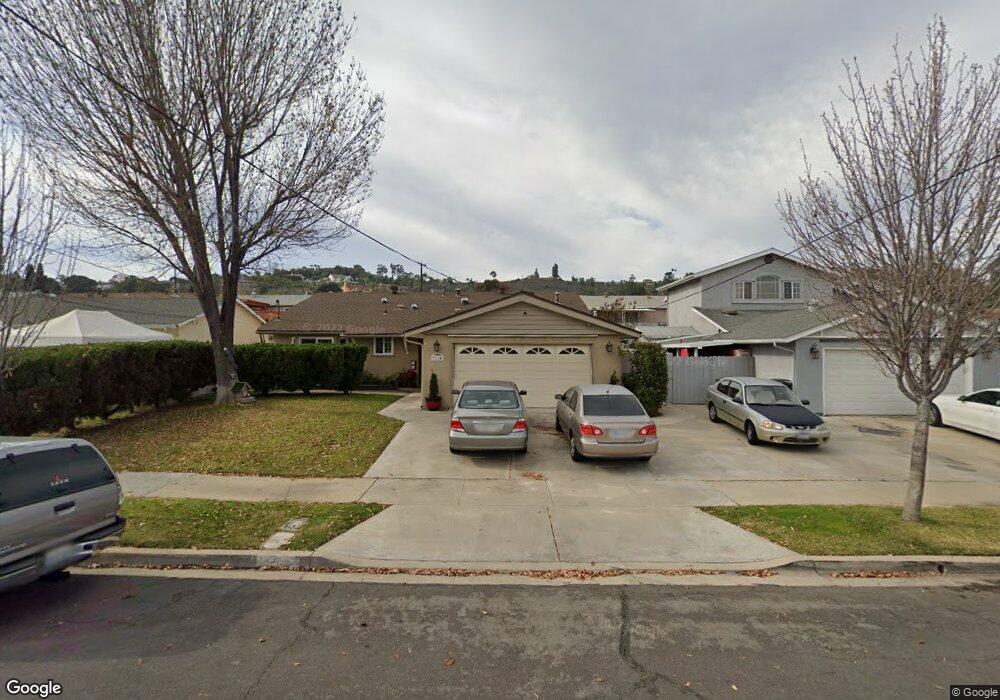
1184 Blackbird St El Cajon, CA 92020
Fletcher Hills NeighborhoodEstimated Value: $784,000 - $961,000
3
Beds
2
Baths
1,873
Sq Ft
$464/Sq Ft
Est. Value
About This Home
This home is located at 1184 Blackbird St, El Cajon, CA 92020 and is currently estimated at $868,487, approximately $463 per square foot. 1184 Blackbird St is a home located in San Diego County with nearby schools including Flying Hills Elementary School, West Hills High School, and Grossmont Secondary School.
Ownership History
Date
Name
Owned For
Owner Type
Purchase Details
Closed on
May 12, 2009
Sold by
Lechner Robert Jerome and Lechner Judith Lynn
Bought by
Lechner Robert Jerome and Lechner Judith Lynn
Current Estimated Value
Purchase Details
Closed on
Jul 17, 2003
Sold by
Lechner Judith L and Lechner Robert J
Bought by
Lechner Robert Jerome and Lechner Judith Lynn
Home Financials for this Owner
Home Financials are based on the most recent Mortgage that was taken out on this home.
Original Mortgage
$165,000
Interest Rate
5.15%
Mortgage Type
Purchase Money Mortgage
Purchase Details
Closed on
Sep 6, 2001
Sold by
Lechner Robert Jerome and Lechner Judith Lynn
Bought by
Lechner Robert Jerome and Lechner Judith Lynn
Purchase Details
Closed on
Apr 2, 1996
Sold by
Lechner Robert J and Lechner Judith L
Bought by
Lechner Robert Jerome and Lechner Judith Lynn
Create a Home Valuation Report for This Property
The Home Valuation Report is an in-depth analysis detailing your home's value as well as a comparison with similar homes in the area
Home Values in the Area
Average Home Value in this Area
Purchase History
| Date | Buyer | Sale Price | Title Company |
|---|---|---|---|
| Lechner Robert Jerome | -- | None Available | |
| Lechner Robert Jerome | -- | None Available | |
| Lechner Robert Jerome | -- | None Available | |
| Lechner Robert Jerome | -- | Chicago Title Co | |
| Lechner Robert J | -- | Chicago Title Co | |
| Lechner Robert Jerome | -- | -- | |
| Lechner Robert Jerome | -- | California Title Company | |
| Lechner Robert Jerome | -- | Gateway Title Company |
Source: Public Records
Mortgage History
| Date | Status | Borrower | Loan Amount |
|---|---|---|---|
| Closed | Lechner Robert J | $165,000 | |
| Closed | Lechner Robert Jerome | $0 |
Source: Public Records
Tax History Compared to Growth
Tax History
| Year | Tax Paid | Tax Assessment Tax Assessment Total Assessment is a certain percentage of the fair market value that is determined by local assessors to be the total taxable value of land and additions on the property. | Land | Improvement |
|---|---|---|---|---|
| 2025 | $3,211 | $202,168 | $23,987 | $178,181 |
| 2024 | $3,211 | $198,205 | $23,517 | $174,688 |
| 2023 | $2,875 | $194,319 | $23,056 | $171,263 |
| 2022 | $3,145 | $190,509 | $22,604 | $167,905 |
| 2021 | $3,380 | $186,774 | $22,161 | $164,613 |
| 2020 | $3,343 | $184,860 | $21,934 | $162,926 |
| 2019 | $2,158 | $181,236 | $21,504 | $159,732 |
| 2018 | $2,122 | $177,683 | $21,083 | $156,600 |
| 2017 | $31 | $174,200 | $20,670 | $153,530 |
| 2016 | $1,076 | $93,285 | $20,265 | $73,020 |
| 2015 | $1,070 | $91,885 | $19,961 | $71,924 |
| 2014 | $1,048 | $90,086 | $19,570 | $70,516 |
Source: Public Records
Map
Nearby Homes
- 1340 Heron Ave
- 1677 Heron Ave
- 1387 Weers St
- 741 N Pierce St
- 701 El Monte Rd
- 0 Hacienda Dr
- 2052 Flying Hills Ln
- 1958 Milford Place
- 2106 Windmill View Rd
- 370 N Cuyamaca St
- 1673 Hillsmont Dr
- 589 N Johnson Ave Unit 247
- 589 N Johnson Ave Unit 130
- 346 El Monte Rd
- 1498 Berenda Place
- 700 Wakefield Ct
- 484 Gardner St
- 2527 Gibbons St
- 2213 Chatham St
- 1280 W Main St Unit 24
- 1178 Blackbird St
- 1198 Blackbird St
- 1185 Grouse St
- 1166 Blackbird St
- 1197 Grouse St
- 1179 Grouse St
- 1167 Grouse St
- 1185 Blackbird St
- 1154 Blackbird St
- 1179 Blackbird St
- 1197 Blackbird St
- 1167 Blackbird St
- 1153 Grouse St
- 1378 Heron Ave
- 1364 Heron Ave
- 1386 Heron Ave
- 1142 Blackbird St
- 1155 Blackbird St
- 1398 Heron Ave
- 1352 Heron Ave