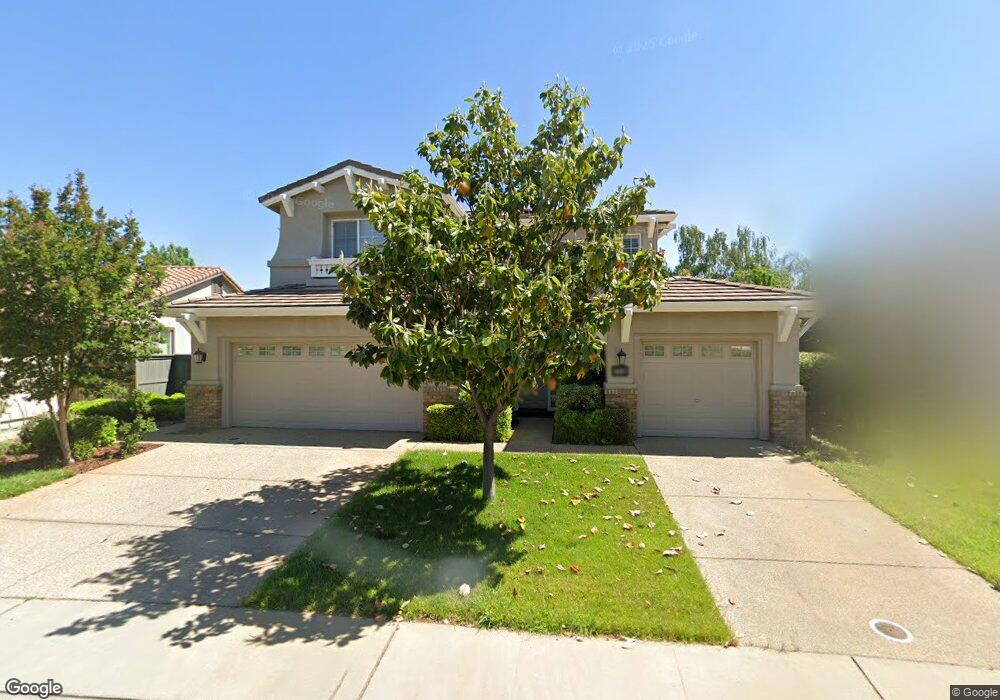
11849 Stone Hollow Way Rancho Cordova, CA 95742
Anatolia NeighborhoodEstimated Value: $500,000 - $693,000
4
Beds
3
Baths
2,550
Sq Ft
$245/Sq Ft
Est. Value
About This Home
This home is located at 11849 Stone Hollow Way, Rancho Cordova, CA 95742 and is currently estimated at $624,367, approximately $244 per square foot. 11849 Stone Hollow Way is a home located in Sacramento County with nearby schools including Sunrise Elementary School, Katherine L. Albiani Middle School, and Pleasant Grove High School.
Ownership History
Date
Name
Owned For
Owner Type
Purchase Details
Closed on
Mar 25, 2008
Sold by
Lucas Glenn H and Young Karen M
Bought by
Lucas Glenn H
Current Estimated Value
Home Financials for this Owner
Home Financials are based on the most recent Mortgage that was taken out on this home.
Original Mortgage
$240,000
Outstanding Balance
$150,077
Interest Rate
5.81%
Mortgage Type
New Conventional
Estimated Equity
$474,290
Purchase Details
Closed on
Sep 11, 2006
Sold by
Lennar Renaissance Inc
Bought by
Lucas Glenn H and Young Karen M
Home Financials for this Owner
Home Financials are based on the most recent Mortgage that was taken out on this home.
Original Mortgage
$353,000
Outstanding Balance
$210,368
Interest Rate
6.53%
Mortgage Type
Purchase Money Mortgage
Estimated Equity
$413,999
Purchase Details
Closed on
Sep 1, 2005
Sold by
Gmac Model Home Finance Inc
Bought by
Lennar Renaissance Inc
Create a Home Valuation Report for This Property
The Home Valuation Report is an in-depth analysis detailing your home's value as well as a comparison with similar homes in the area
Home Values in the Area
Average Home Value in this Area
Purchase History
| Date | Buyer | Sale Price | Title Company |
|---|---|---|---|
| Lucas Glenn H | -- | First American Title Insuran | |
| Lucas Glenn H | $453,500 | North American Title Co | |
| Lennar Renaissance Inc | -- | North American Title Co |
Source: Public Records
Mortgage History
| Date | Status | Borrower | Loan Amount |
|---|---|---|---|
| Open | Lucas Glenn H | $240,000 | |
| Open | Lucas Glenn H | $353,000 |
Source: Public Records
Tax History Compared to Growth
Tax History
| Year | Tax Paid | Tax Assessment Tax Assessment Total Assessment is a certain percentage of the fair market value that is determined by local assessors to be the total taxable value of land and additions on the property. | Land | Improvement |
|---|---|---|---|---|
| 2025 | $8,309 | $540,083 | $198,988 | $341,095 |
| 2024 | $8,309 | $529,494 | $195,087 | $334,407 |
| 2023 | $8,099 | $519,112 | $191,262 | $327,850 |
| 2022 | $7,927 | $508,934 | $187,512 | $321,422 |
| 2021 | $7,868 | $498,956 | $183,836 | $315,120 |
| 2020 | $7,751 | $493,840 | $181,951 | $311,889 |
| 2019 | $7,604 | $484,158 | $178,384 | $305,774 |
| 2018 | $7,231 | $458,696 | $89,190 | $369,506 |
| 2017 | $6,830 | $424,720 | $82,584 | $342,136 |
| 2016 | $6,517 | $400,680 | $77,910 | $322,770 |
| 2015 | $6,218 | $378,000 | $73,500 | $304,500 |
| 2014 | $5,995 | $360,000 | $70,000 | $290,000 |
Source: Public Records
Map
Nearby Homes
- 4048 Kalamata Way
- 11816 Spring Walk Way
- 11791 Battenburg Way
- 4160 Anatolia Dr
- 11790 Bagota Way
- 4081 Valance Way
- 11751 Village Pond Way
- 11794 Dionysus Way
- 11708 Dionysus Way
- 4036 Valance Way
- 11918 Herodian Dr
- 11926 Herodian Dr
- 11728 Dionysus Way
- Plan 1 at Montelena - Vista
- Plan 1 at Montelena - Ascent
- Plan 4 at Montelena - Ascent
- Plan 2 at Montelena - Ascent
- Plan 3 at Montelena - Ascent
- Plan 1 at Montelena - Solis
- 11781 Plato Way
- 11845 Stone Hollow Way
- 11853 Stone Hollow Way
- 11856 Autumn Sunset Way
- 11860 Autumn Sunset Way
- 11852 Autumn Sunset Way
- 11841 Stone Hollow Way
- 4171 Lauren Ct
- 11857 Stone Hollow Way
- 11848 Autumn Sunset Way
- 11864 Autumn Sunset Way
- 4144 Tulip Park Way
- 11861 Stone Hollow Way
- 11844 Autumn Sunset Way
- 4148 Tulip Park Way
- 11858 Stone Hollow Way
- 4177 Lauren Ct
- 4152 Tulip Park Way
- 11855 Autumn Sunset Way
- 11838 Autumn Sunset Way
- 11859 Autumn Sunset Way