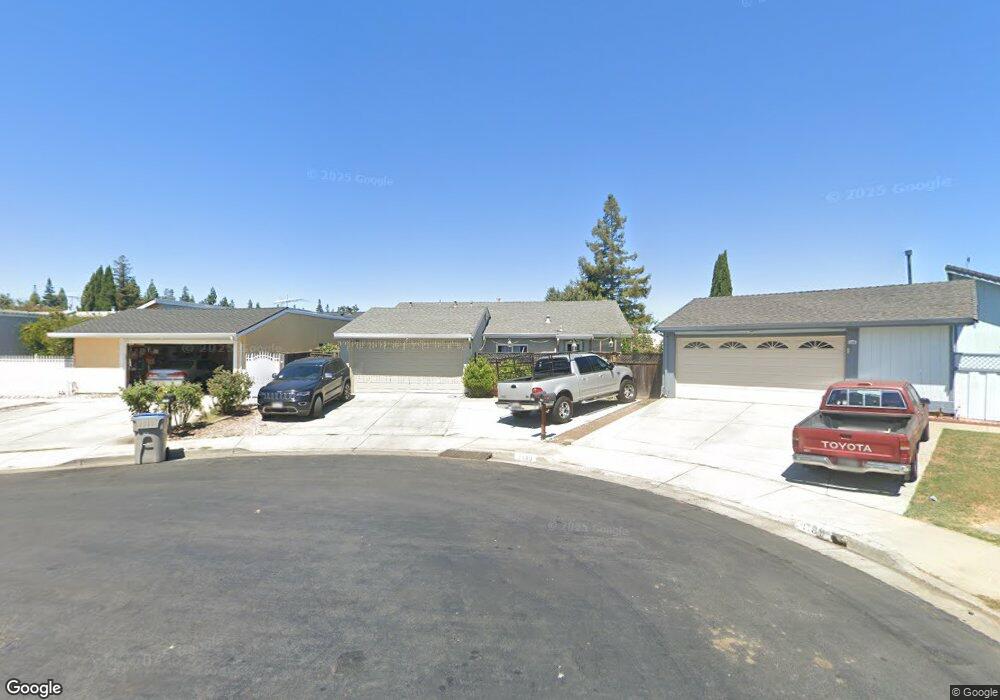
1185 Camano Ct San Jose, CA 95122
Meadows NeighborhoodEstimated Value: $1,033,000 - $1,075,000
3
Beds
2
Baths
1,155
Sq Ft
$914/Sq Ft
Est. Value
About This Home
This home is located at 1185 Camano Ct, San Jose, CA 95122 and is currently estimated at $1,055,313, approximately $913 per square foot. 1185 Camano Ct is a home located in Santa Clara County with nearby schools including Jeanne R. Meadows Elementary School, Sylvandale Middle School, and Yerba Buena High School.
Ownership History
Date
Name
Owned For
Owner Type
Purchase Details
Closed on
Oct 15, 2024
Sold by
Wong Vincent S and Cheng Winnie S
Bought by
Cheng Winnie S
Current Estimated Value
Purchase Details
Closed on
Jan 5, 2018
Sold by
Tirado Angela M
Bought by
Wong Vincent S and Cheng Winnie S
Purchase Details
Closed on
Jul 13, 2017
Sold by
Tirado Angela M and Mollick Brian
Bought by
Tirado Angela M and Mollick Brian
Purchase Details
Closed on
Nov 7, 2016
Sold by
Tirado Angela M
Bought by
Tirado Angela M and Mollick Brian
Purchase Details
Closed on
Nov 29, 1996
Sold by
Luna Tomas
Bought by
Tirado Angela M
Purchase Details
Closed on
Aug 29, 1996
Sold by
Bardin Stewart Lyman and Bardin Maria Socorro C
Bought by
Luna Tomas and Tirado Angela M
Home Financials for this Owner
Home Financials are based on the most recent Mortgage that was taken out on this home.
Original Mortgage
$168,300
Interest Rate
7.88%
Create a Home Valuation Report for This Property
The Home Valuation Report is an in-depth analysis detailing your home's value as well as a comparison with similar homes in the area
Home Values in the Area
Average Home Value in this Area
Purchase History
| Date | Buyer | Sale Price | Title Company |
|---|---|---|---|
| Cheng Winnie S | -- | None Listed On Document | |
| Wong Vincent S | $576,000 | None Available | |
| Tirado Angela M | -- | None Available | |
| Tirado Angela M | -- | None Available | |
| Tirado Angela M | -- | -- | |
| Luna Tomas | $187,000 | American Title Ins Co |
Source: Public Records
Mortgage History
| Date | Status | Borrower | Loan Amount |
|---|---|---|---|
| Previous Owner | Luna Tomas | $168,300 |
Source: Public Records
Tax History Compared to Growth
Tax History
| Year | Tax Paid | Tax Assessment Tax Assessment Total Assessment is a certain percentage of the fair market value that is determined by local assessors to be the total taxable value of land and additions on the property. | Land | Improvement |
|---|---|---|---|---|
| 2025 | $13,343 | $887,503 | $625,804 | $261,699 |
| 2024 | $13,343 | $870,102 | $613,534 | $256,568 |
| 2023 | $13,180 | $853,042 | $601,504 | $251,538 |
| 2022 | $12,877 | $836,316 | $589,710 | $246,606 |
| 2021 | $12,817 | $819,919 | $578,148 | $241,771 |
| 2020 | $12,382 | $811,512 | $572,220 | $239,292 |
| 2019 | $11,862 | $795,600 | $561,000 | $234,600 |
| 2018 | $4,730 | $267,657 | $114,503 | $153,154 |
| 2017 | $4,664 | $262,409 | $112,258 | $150,151 |
| 2016 | $4,436 | $257,264 | $110,057 | $147,207 |
| 2015 | $5,316 | $253,400 | $108,404 | $144,996 |
| 2014 | $4,336 | $248,437 | $106,281 | $142,156 |
Source: Public Records
Map
Nearby Homes
- 1117 Indian Summer Ct
- 1042 Summermist Ct Unit 107
- 2175 Summerton Dr
- 1050 Summermist Ct
- 1087 Summerain Ct
- 1077 Summerain Ct
- 1068 Summershore Ct
- 1058 Tekman Dr Unit 58
- 2416 Balme Dr
- 2015 Tahiti Ct
- 988 Summerplace Dr
- 1381 Taper Ct
- 1231 Turtlerock Dr
- 1887 Aberdeen Ct
- 2102 Galveston Ave Unit A
- 2102 Galveston Ave Unit B
- 1051 Keldon Dr
- 2040 Lanai Ave
- 2566 Boren Dr
- 963 Mills Corner Ln
- 1173 Camano Ct
- 1189 Camano Ct
- 1180 Bayard Dr
- 1186 Bayard Dr
- 1174 Bayard Dr
- 1192 Bayard Dr
- 1188 Camano Ct
- 1168 Bayard Dr
- 1223 Spokane Dr
- 1227 Spokane Dr
- 1161 Camano Ct
- 1176 Camano Ct
- 1184 Camano Ct
- 1219 Spokane Dr
- 1172 Camano Ct
- 1162 Bayard Dr
- 1231 Spokane Dr
- 1215 Spokane Dr
- 1164 Camano Ct
- 1153 Camano Ct