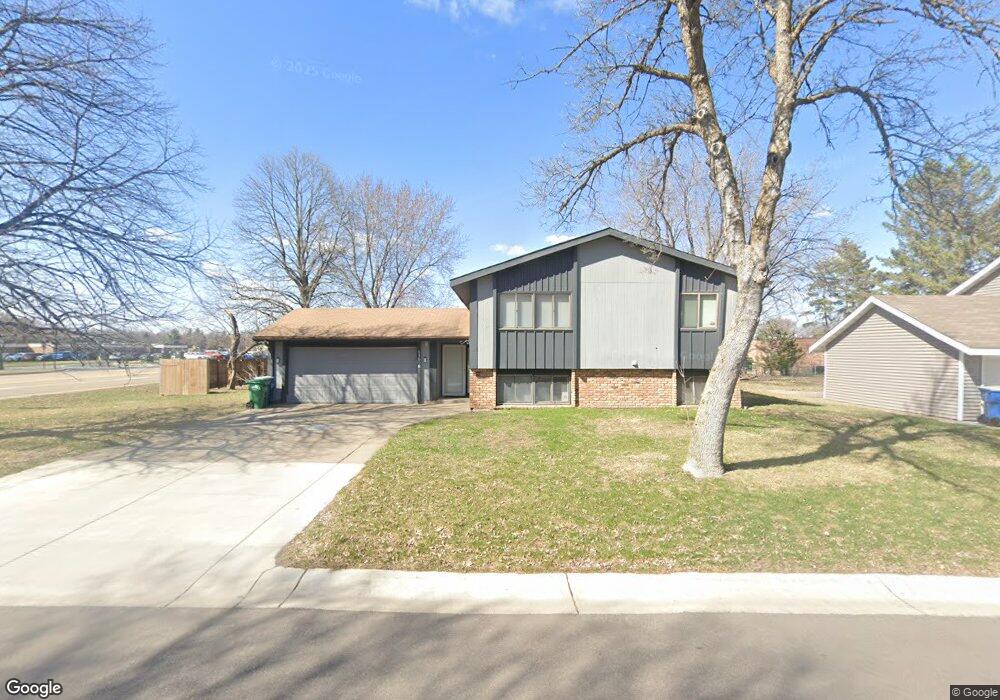
11898 67th Place N Maple Grove, MN 55369
Estimated Value: $382,000 - $398,016
4
Beds
2
Baths
2,048
Sq Ft
$189/Sq Ft
Est. Value
About This Home
This home is located at 11898 67th Place N, Maple Grove, MN 55369 and is currently estimated at $387,004, approximately $188 per square foot. 11898 67th Place N is a home located in Hennepin County with nearby schools including Cedar Island Elementary School, Maple Grove Middle School, and Osseo Senior High School.
Ownership History
Date
Name
Owned For
Owner Type
Purchase Details
Closed on
Oct 15, 2019
Sold by
Hemlock Rental Llc
Bought by
Sadek Candice Marie and Colosimo Michael A
Current Estimated Value
Home Financials for this Owner
Home Financials are based on the most recent Mortgage that was taken out on this home.
Original Mortgage
$261,250
Outstanding Balance
$229,566
Interest Rate
3.65%
Mortgage Type
New Conventional
Estimated Equity
$157,438
Purchase Details
Closed on
Feb 26, 2015
Sold by
Chen Meilan and Murzyn John
Bought by
Hemlock Rental Llc
Purchase Details
Closed on
Mar 25, 2009
Sold by
Gmac Mortgage Llc
Bought by
Chen Hoa D and Chen Bruce
Purchase Details
Closed on
Feb 6, 2006
Sold by
Mahmoud Eric and Mahmoud Ella
Bought by
Schneider James R
Purchase Details
Closed on
Feb 19, 2004
Sold by
Brossard Shannon M
Bought by
Mahmoud Eric
Purchase Details
Closed on
Oct 31, 1997
Sold by
Haddad Richard and Haddad Antoinette
Bought by
Brossard Guy E and Brossard Shannon M
Create a Home Valuation Report for This Property
The Home Valuation Report is an in-depth analysis detailing your home's value as well as a comparison with similar homes in the area
Home Values in the Area
Average Home Value in this Area
Purchase History
| Date | Buyer | Sale Price | Title Company |
|---|---|---|---|
| Sadek Candice Marie | $275,000 | All American Title Company | |
| Hemlock Rental Llc | -- | None Available | |
| Chen Hoa D | $140,000 | -- | |
| Schneider James R | $231,389 | -- | |
| Mahmoud Eric | $254,000 | -- | |
| Brossard Guy E | $110,000 | -- |
Source: Public Records
Mortgage History
| Date | Status | Borrower | Loan Amount |
|---|---|---|---|
| Open | Sadek Candice Marie | $261,250 |
Source: Public Records
Tax History Compared to Growth
Tax History
| Year | Tax Paid | Tax Assessment Tax Assessment Total Assessment is a certain percentage of the fair market value that is determined by local assessors to be the total taxable value of land and additions on the property. | Land | Improvement |
|---|---|---|---|---|
| 2024 | $4,677 | $352,800 | $123,300 | $229,500 |
| 2023 | $4,563 | $349,100 | $114,900 | $234,200 |
| 2022 | $3,318 | $359,700 | $112,000 | $247,700 |
| 2021 | $3,316 | $282,600 | $70,200 | $212,400 |
| 2020 | $3,477 | $277,000 | $70,200 | $206,800 |
| 2019 | $3,490 | $277,400 | $79,300 | $198,100 |
| 2018 | $3,256 | $253,400 | $66,300 | $187,100 |
| 2017 | $3,232 | $220,900 | $60,000 | $160,900 |
| 2016 | $3,403 | $229,000 | $73,000 | $156,000 |
| 2015 | $3,072 | $201,000 | $57,500 | $143,500 |
| 2014 | -- | $190,100 | $60,000 | $130,100 |
Source: Public Records
Map
Nearby Homes
- 11649 Gentilly Rd
- 6905 Ives Ln N
- 6942 Ives Ln N
- 6477 Deerwood Ln N
- 6450 Deerwood Ln N
- 6718 Marilyn Dr
- 11081 69th Ave N
- 12083 Robin Rd
- 10947 69th Ave N
- 7000 Yorktown Ln N
- 7240 Timber Ln N
- 7169 Birchview Rd
- 7087 Wellington Ln N
- 12891 73rd Ave N
- 12803 74th Ave N
- 12350 61st Ave N
- 7224 Vinewood Ln N
- 6412 Xenium Ln N
- 13505 63rd Ave N
- 11755 Bass Lake Rd
- 11850 67th Place N
- 11824 67th Place N
- 6722 Hemlock Ln N
- 11800 67th Place N
- 6729 Hemlock Ln N
- 11798 67th Place N
- 6686 Ives Ln N
- 11750 67th Place N
- 6682 Ives Ln N
- 11724 67th Place N
- 6650 Hemlock Ln N
- 11802 Gentilly Rd
- 11725 67th Place N
- 6676 Ives Ln N
- 6688 Ives Ln N
- 6684 Ives Ln N
- 6743 Evergreen Ln N
- 6678 Ives Ln N
- 6672 Ives Ln N
- 11700 67th Place N