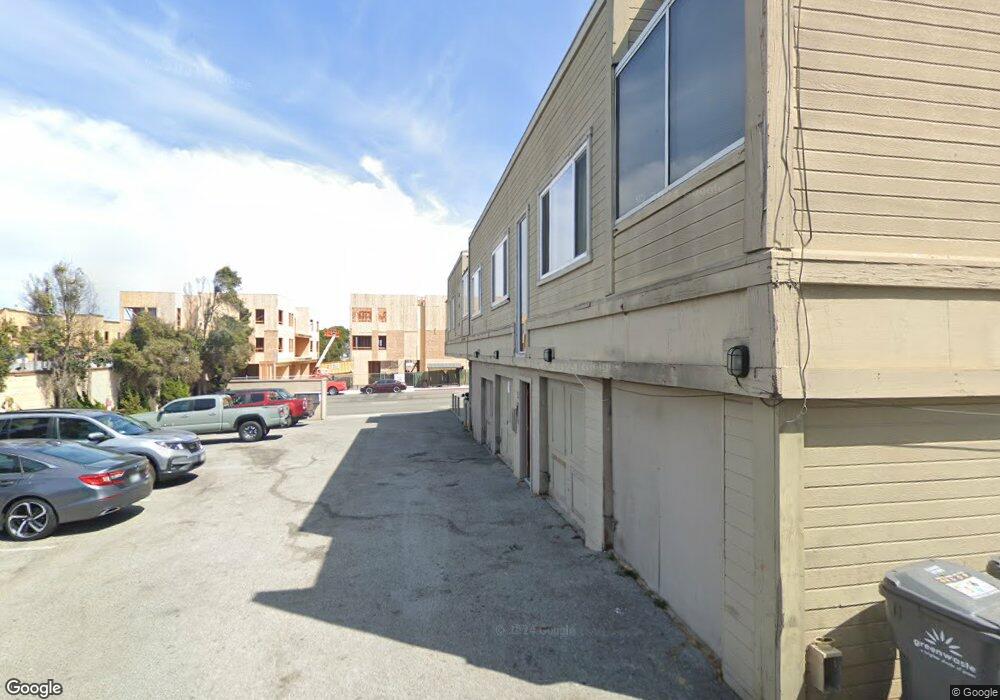
1196 Broadway Ave Seaside, CA 93955
--
Bed
--
Bath
6,000
Sq Ft
8,494
Sq Ft Lot
About This Home
This home is located at 1196 Broadway Ave, Seaside, CA 93955. 1196 Broadway Ave is a home located in Monterey County with nearby schools including Martin Luther King, Seaside Middle School, and Seaside High School.
Ownership History
Date
Name
Owned For
Owner Type
Purchase Details
Closed on
Nov 9, 2013
Sold by
California Foreclosue Prevention Inc
Bought by
Aslan Residential I Llc
Purchase Details
Closed on
Feb 22, 2011
Sold by
Whitaker Donald A and Whitaker Rosanne M
Bought by
Cypress Investments Llc
Purchase Details
Closed on
Dec 7, 2006
Sold by
Coulter Kelly S and Coulter Karla D
Bought by
Whitaker Donald A and Whitaker Rosanne M
Purchase Details
Closed on
May 5, 2005
Sold by
Coulter Kelly S and Coulter Karla D
Bought by
Coulter Kelly S and Coulter Karla D
Purchase Details
Closed on
Aug 16, 2002
Sold by
Singleton Ernest J and Singleton Dorothy A
Bought by
Whitaker Donald A and Whitaker Rosanne M
Home Financials for this Owner
Home Financials are based on the most recent Mortgage that was taken out on this home.
Original Mortgage
$438,750
Interest Rate
6.52%
Mortgage Type
Commercial
Purchase Details
Closed on
Oct 12, 2000
Sold by
Singleton Ernest J and Singleton Dorothy A
Bought by
Singleton Ernest J and Singleton Dorothy A
Create a Home Valuation Report for This Property
The Home Valuation Report is an in-depth analysis detailing your home's value as well as a comparison with similar homes in the area
Home Values in the Area
Average Home Value in this Area
Purchase History
| Date | Buyer | Sale Price | Title Company |
|---|---|---|---|
| Aslan Residential I Llc | -- | Accommodation | |
| Cypress Investments Llc | $650,000 | Old Republic Title Company | |
| Whitaker Donald A | -- | Chicago Title Co | |
| Coulter Kelly S | -- | -- | |
| Whitaker Donald A | $675,000 | Old Republic Title Company | |
| Singleton Ernest J | -- | -- | |
| Singleton Ernest J | -- | -- |
Source: Public Records
Mortgage History
| Date | Status | Borrower | Loan Amount |
|---|---|---|---|
| Previous Owner | Whitaker Donald A | $438,750 |
Source: Public Records
Tax History Compared to Growth
Tax History
| Year | Tax Paid | Tax Assessment Tax Assessment Total Assessment is a certain percentage of the fair market value that is determined by local assessors to be the total taxable value of land and additions on the property. | Land | Improvement |
|---|---|---|---|---|
| 2025 | $8,830 | $832,754 | $288,259 | $544,495 |
| 2024 | $8,830 | $816,426 | $282,607 | $533,819 |
| 2023 | $9,202 | $800,418 | $277,066 | $523,352 |
| 2022 | $9,082 | $784,725 | $271,634 | $513,091 |
| 2021 | $8,956 | $769,339 | $266,308 | $503,031 |
| 2020 | $8,635 | $761,452 | $263,578 | $497,874 |
| 2019 | $9,041 | $746,522 | $258,410 | $488,112 |
| 2018 | $8,698 | $731,886 | $253,344 | $478,542 |
| 2017 | $8,088 | $717,536 | $248,377 | $469,159 |
| 2016 | $7,952 | $703,467 | $243,507 | $459,960 |
| 2015 | $7,844 | $692,901 | $239,850 | $453,051 |
| 2014 | $7,716 | $679,329 | $235,152 | $444,177 |
Source: Public Records
Map
Nearby Homes
- 1195 Elm Ave
- 1140 Palm Ave
- 1252 Olympia Ave
- 1146 Birch Ave Unit 19
- 1125 Hamilton Ave
- 1713 Goodwin St
- 1524 Luxton St
- 1212 Trinity Ave Unit 10
- 1336 Luxton St
- 1714 Luxton St
- 1622 Flores St
- 1676 Flores St
- 1787 Laguna St
- 1615 Luzern St
- 967 Hilby Ave Unit C
- 1609 Soto St
- 1213 Flores St
- 1778 Harding St
- 1455 Yosemite St
- 1868 Lowell St