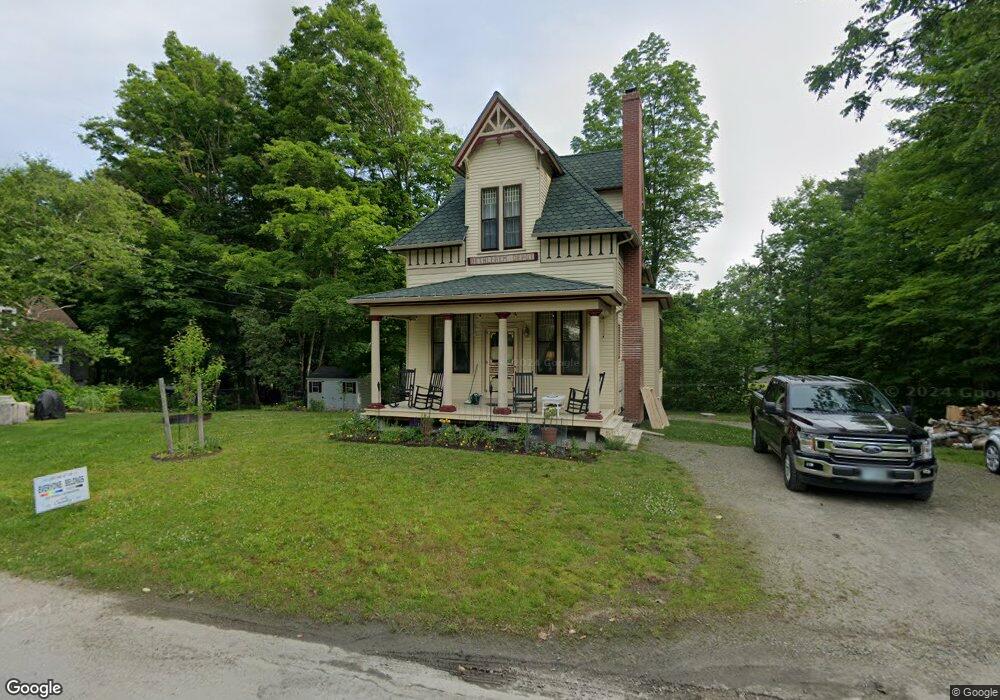
12 Birchmere St Bethlehem, NH 03574
Estimated Value: $331,000 - $386,000
3
Beds
2
Baths
1,435
Sq Ft
$247/Sq Ft
Est. Value
About This Home
This home is located at 12 Birchmere St, Bethlehem, NH 03574 and is currently estimated at $354,786, approximately $247 per square foot. 12 Birchmere St is a home located in Grafton County with nearby schools including Bethlehem Elementary School, Profile Junior High School, and Profile Senior High School.
Ownership History
Date
Name
Owned For
Owner Type
Purchase Details
Closed on
Jul 15, 2025
Sold by
Caplain Bruce and Quieroga Ayla
Bought by
Plan B Rentals Llc
Current Estimated Value
Purchase Details
Closed on
Apr 16, 2025
Sold by
Caplain Bruce
Bought by
Plan B Ret and Caplain
Purchase Details
Closed on
May 26, 2015
Sold by
Caplain Bruce N
Bought by
Caplain Bruce N
Purchase Details
Closed on
Oct 2, 2007
Sold by
Hays Eliot J and Hays Laura Ellen
Bought by
Caplain Bruce N and Caplain Carmela
Home Financials for this Owner
Home Financials are based on the most recent Mortgage that was taken out on this home.
Original Mortgage
$105,000
Interest Rate
6.65%
Mortgage Type
Purchase Money Mortgage
Purchase Details
Closed on
Sep 13, 2000
Sold by
Medeiros Jeffrey A and Medeiros Debra A
Bought by
Dolloff Peter
Home Financials for this Owner
Home Financials are based on the most recent Mortgage that was taken out on this home.
Original Mortgage
$65,000
Interest Rate
8.07%
Create a Home Valuation Report for This Property
The Home Valuation Report is an in-depth analysis detailing your home's value as well as a comparison with similar homes in the area
Home Values in the Area
Average Home Value in this Area
Purchase History
| Date | Buyer | Sale Price | Title Company |
|---|---|---|---|
| Plan B Rentals Llc | -- | -- | |
| Plan B Rentals Llc | -- | -- | |
| Plan B Ret | -- | None Available | |
| Plan B Ret | -- | None Available | |
| Caplain Bruce N | -- | -- | |
| Caplain Bruce N | -- | -- | |
| Caplain Bruce N | $148,000 | -- | |
| Caplain Bruce N | $148,000 | -- | |
| Dolloff Peter | $46,000 | -- | |
| Dolloff Peter | $46,000 | -- |
Source: Public Records
Mortgage History
| Date | Status | Borrower | Loan Amount |
|---|---|---|---|
| Previous Owner | Dolloff Peter | $105,000 | |
| Previous Owner | Dolloff Peter | $65,000 |
Source: Public Records
Tax History
| Year | Tax Paid | Tax Assessment Tax Assessment Total Assessment is a certain percentage of the fair market value that is determined by local assessors to be the total taxable value of land and additions on the property. | Land | Improvement |
|---|---|---|---|---|
| 2024 | $4,879 | $284,000 | $50,300 | $233,700 |
| 2023 | $4,382 | $284,000 | $50,300 | $233,700 |
| 2022 | $3,935 | $164,700 | $16,900 | $147,800 |
| 2021 | $4,083 | $164,700 | $16,900 | $147,800 |
| 2020 | $0 | $164,700 | $16,900 | $147,800 |
| 2019 | $4,400 | $164,600 | $16,900 | $147,700 |
| 2018 | $0 | $164,600 | $16,900 | $147,700 |
| 2017 | $3,905 | $127,100 | $16,100 | $111,000 |
| 2016 | $0 | $118,900 | $16,100 | $102,800 |
| 2015 | $3,522 | $118,900 | $16,100 | $102,800 |
| 2013 | $3,395 | $118,900 | $16,100 | $102,800 |
Source: Public Records
Map
Nearby Homes
- 42 Maple St
- 28 Jodo Way
- 7 James St
- 15 Okane Ave
- 16 3rd St
- 206 Lewis Hill Rd
- 2480 Main St
- 105 Alpenhof Rd
- O Main St
- 1 Agassiz St
- 264 Wing Rd
- 000 Ridge Rd Unit 28
- 00 Ridge Rd Unit 42
- 961 Maple St
- 686 Wing Rd
- 99 Whitefield Rd
- 0 Thorn Hill Rd Unit 22 5063258
- 61 Thorn Hill Rd
- 637 Wallace Hill Rd
- 102 Skyline Dr
Your Personal Tour Guide
Ask me questions while you tour the home.