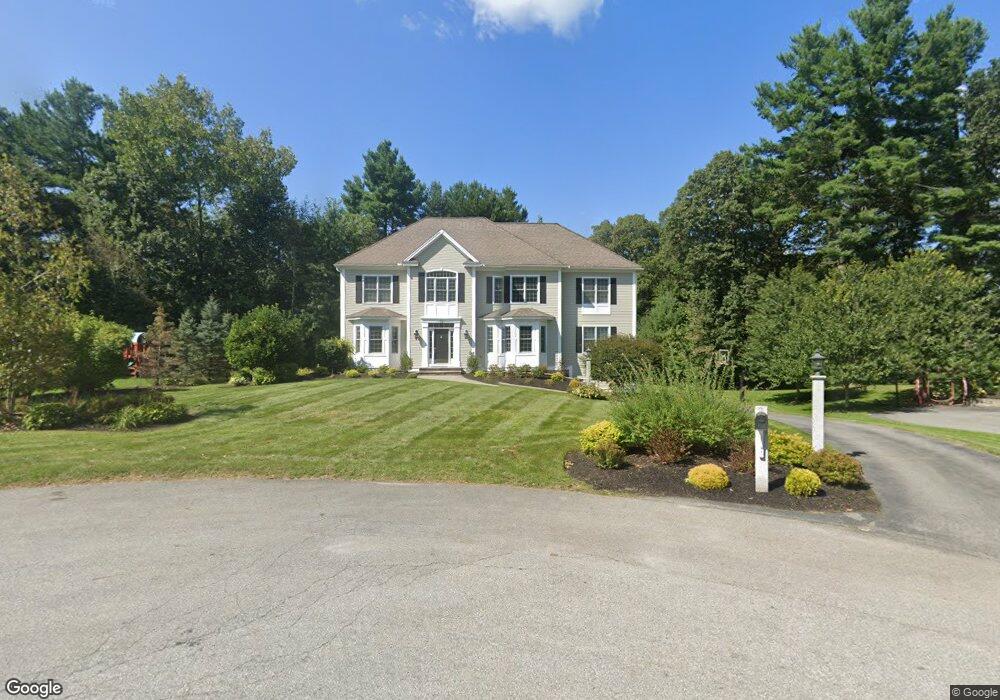
12 Dawn Cir Andover, MA 01810
West Andover NeighborhoodEstimated Value: $1,579,000 - $1,683,000
4
Beds
3
Baths
3,700
Sq Ft
$437/Sq Ft
Est. Value
About This Home
This home is located at 12 Dawn Cir, Andover, MA 01810 and is currently estimated at $1,617,706, approximately $437 per square foot. 12 Dawn Cir is a home with nearby schools including Henry C. Sanborn Elementary School, Andover West Middle School, and Andover High School.
Ownership History
Date
Name
Owned For
Owner Type
Purchase Details
Closed on
Nov 2, 2011
Sold by
Conlin Dennis A and Conlin Christine N
Bought by
Conlin Rt and Conlin
Current Estimated Value
Home Financials for this Owner
Home Financials are based on the most recent Mortgage that was taken out on this home.
Original Mortgage
$235,000
Interest Rate
4.11%
Mortgage Type
Stand Alone Second
Purchase Details
Closed on
Oct 31, 2011
Sold by
Conlin Rt and Conlin
Bought by
Conlin Dennis A and Conlin Christine N
Home Financials for this Owner
Home Financials are based on the most recent Mortgage that was taken out on this home.
Original Mortgage
$235,000
Interest Rate
4.11%
Mortgage Type
Stand Alone Second
Purchase Details
Closed on
May 16, 2005
Sold by
Conlin Dawn A and Conlin Christine N
Bought by
Conlin Rt and Conlin
Purchase Details
Closed on
Mar 1, 2005
Sold by
Belmont Builders Inc
Bought by
Conlin Christine N and Conlin Dennis A
Home Financials for this Owner
Home Financials are based on the most recent Mortgage that was taken out on this home.
Original Mortgage
$359,650
Interest Rate
5.73%
Mortgage Type
Purchase Money Mortgage
Create a Home Valuation Report for This Property
The Home Valuation Report is an in-depth analysis detailing your home's value as well as a comparison with similar homes in the area
Home Values in the Area
Average Home Value in this Area
Purchase History
| Date | Buyer | Sale Price | Title Company |
|---|---|---|---|
| Conlin Rt | -- | -- | |
| Conlin Dennis A | -- | -- | |
| Conlin Rt | -- | -- | |
| Conlin Christine N | $875,000 | -- |
Source: Public Records
Mortgage History
| Date | Status | Borrower | Loan Amount |
|---|---|---|---|
| Closed | Conlin Dennis A | $235,000 | |
| Previous Owner | Conlin Christine N | $359,650 |
Source: Public Records
Tax History Compared to Growth
Tax History
| Year | Tax Paid | Tax Assessment Tax Assessment Total Assessment is a certain percentage of the fair market value that is determined by local assessors to be the total taxable value of land and additions on the property. | Land | Improvement |
|---|---|---|---|---|
| 2024 | $17,436 | $1,353,700 | $535,700 | $818,000 |
| 2023 | $16,426 | $1,202,500 | $458,600 | $743,900 |
| 2022 | $15,743 | $1,078,300 | $413,800 | $664,500 |
| 2021 | $15,140 | $990,200 | $376,700 | $613,500 |
| 2020 | $14,719 | $980,600 | $376,700 | $603,900 |
| 2019 | $14,513 | $950,400 | $355,800 | $594,600 |
| 2018 | $14,012 | $895,900 | $345,800 | $550,100 |
| 2017 | $13,481 | $888,100 | $339,300 | $548,800 |
| 2016 | $13,473 | $909,100 | $356,700 | $552,400 |
| 2015 | $13,178 | $880,300 | $356,700 | $523,600 |
Source: Public Records
Map
Nearby Homes
- 37 Crenshaw Ln Unit 37
- 25 Clubview Dr Unit 25
- 13 Clubview Dr Unit 13
- 15 Geneva Rd
- 14 Geneva Rd
- 21 Clubview Dr Unit 21
- 22 Haggetts Pond Rd
- 38 Lincoln Cir E
- 29 Glenwood Dr
- 18 Bryan Ln Unit 18
- 0
- 96 Beacon St
- 42 Stevens St
- 105 Central St
- 103 Central St
- 10 Martingale Ln Unit 10
- 5 Castle Heights Rd
- 5 Marc Ln
- 2 Powder Mill Square Unit 2B
- 6 Windsor St