Estimated Value: $806,000 - $1,218,000
2
Beds
1
Bath
1,176
Sq Ft
$795/Sq Ft
Est. Value
About This Home
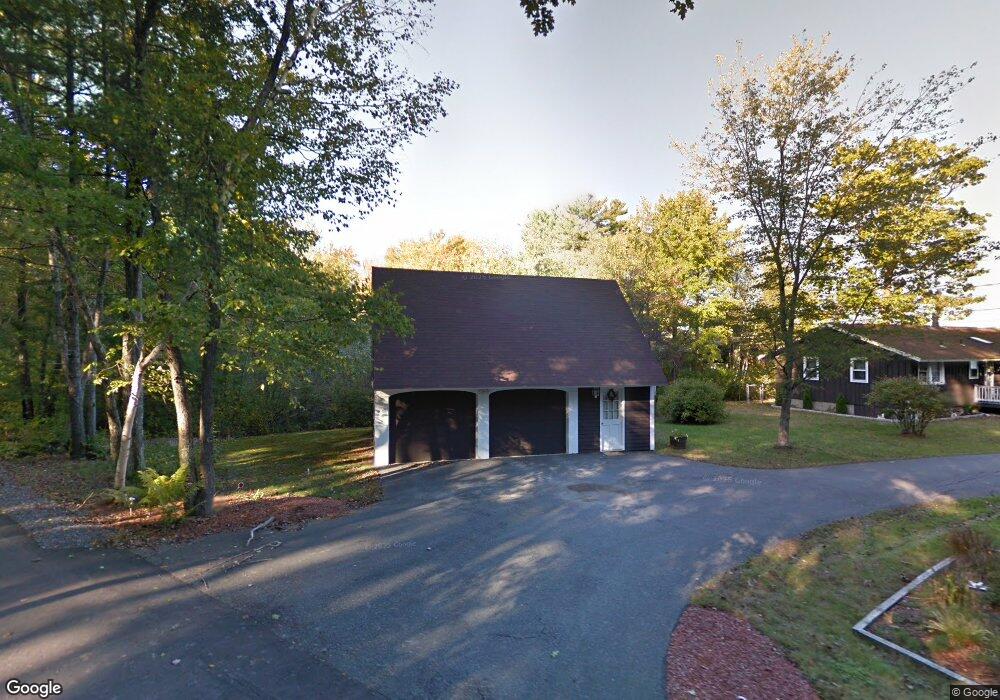
This home is located at 12 Dixon Ln, Derry, NH 03038 and is currently estimated at $935,260, approximately $795 per square foot. 12 Dixon Ln is a home located in Rockingham County with nearby schools including East Derry Memorial Elementary School, West Running Brook Middle School, and Pinkerton Academy.
Ownership History
Date
Name
Owned For
Owner Type
Purchase Details
Closed on
Aug 1, 2023
Sold by
Ralich Meaghan
Bought by
Meaghan M Ralich Ret and Ralich
Current Estimated Value
Purchase Details
Closed on
Jun 5, 2018
Sold by
Lonardo Charles L and Lonardo Glenda C
Bought by
Ralich Meaghan
Purchase Details
Closed on
Jan 21, 2009
Sold by
Emery Richard A and Emery Gladys E
Bought by
Lonardo Charles L and Lonardo Glenda C
Create a Home Valuation Report for This Property
The Home Valuation Report is an in-depth analysis detailing your home's value as well as a comparison with similar homes in the area
Home Values in the Area
Average Home Value in this Area
Purchase History
| Date | Buyer | Sale Price | Title Company |
|---|---|---|---|
| Meaghan M Ralich Ret | -- | None Available | |
| Ralich Meaghan | $515,000 | -- | |
| Ralich Meaghan | $515,000 | -- | |
| Lonardo Charles L | $400,000 | -- | |
| Lonardo Charles L | $400,000 | -- |
Source: Public Records
Mortgage History
| Date | Status | Borrower | Loan Amount |
|---|---|---|---|
| Previous Owner | Lonardo Charles L | $224,000 |
Source: Public Records
Tax History Compared to Growth
Tax History
| Year | Tax Paid | Tax Assessment Tax Assessment Total Assessment is a certain percentage of the fair market value that is determined by local assessors to be the total taxable value of land and additions on the property. | Land | Improvement |
|---|---|---|---|---|
| 2024 | $16,328 | $873,600 | $700,600 | $173,000 |
| 2023 | $15,975 | $772,500 | $620,200 | $152,300 |
| 2022 | $14,708 | $772,500 | $620,200 | $152,300 |
| 2021 | $12,771 | $515,800 | $396,100 | $119,700 |
| 2020 | $12,555 | $515,800 | $396,100 | $119,700 |
| 2019 | $11,736 | $449,300 | $341,800 | $107,500 |
| 2018 | $11,716 | $450,100 | $341,800 | $108,300 |
| 2017 | $2,910 | $407,400 | $312,200 | $95,200 |
| 2016 | $11,024 | $407,400 | $312,200 | $95,200 |
| 2015 | $11,660 | $398,900 | $312,200 | $86,700 |
| 2014 | $11,736 | $398,900 | $312,200 | $86,700 |
| 2013 | $12,602 | $400,200 | $310,700 | $89,500 |
Source: Public Records
Map
Nearby Homes
- 120 Chases Grove Rd
- 117C Chases Grove Rd
- 116 Chases Grove Rd
- 6 Weston St
- 35 Steele Rd
- 67 & 69 Conleys Grove Rd
- 9 Valcat Ln
- Lot 22-50 Valcat Ln
- 3 Anna Cir
- 18 Lorri Rd
- 40 Coles Way
- 160 Mills Shore Dr
- 21 Coles Way
- 73 Drew Rd
- 20 Chandler Dr
- 62 Veterans Way
- 37 Houstons Way
- 29 Hawk Dr
- 21 Teague Dr
- 16 Autumn Woods Rd