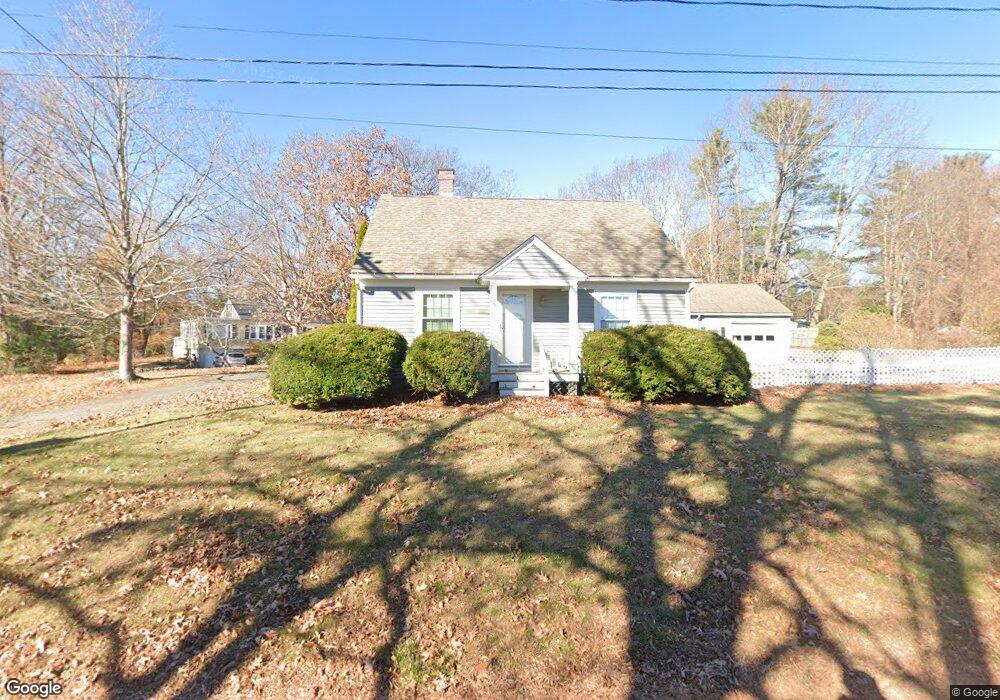
12 Elm Rd North Hampton, NH 03862
Estimated Value: $1,591,793
--
Bed
--
Bath
3,200
Sq Ft
$497/Sq Ft
Est. Value
About This Home
This home is located at 12 Elm Rd, North Hampton, NH 03862 and is currently estimated at $1,591,793, approximately $497 per square foot. 12 Elm Rd is a home located in Rockingham County with nearby schools including North Hampton School, Winnacunnet High School, and Rye Country Day School.
Ownership History
Date
Name
Owned For
Owner Type
Purchase Details
Closed on
Jun 28, 2017
Sold by
12 Elm Dev
Bought by
Elm Road Industrial Pa
Current Estimated Value
Home Financials for this Owner
Home Financials are based on the most recent Mortgage that was taken out on this home.
Original Mortgage
$640,000
Outstanding Balance
$533,622
Interest Rate
4.02%
Mortgage Type
Commercial
Estimated Equity
$1,058,171
Purchase Details
Closed on
Jun 1, 1987
Bought by
12 Elm Development
Create a Home Valuation Report for This Property
The Home Valuation Report is an in-depth analysis detailing your home's value as well as a comparison with similar homes in the area
Home Values in the Area
Average Home Value in this Area
Purchase History
| Date | Buyer | Sale Price | Title Company |
|---|---|---|---|
| Elm Road Industrial Pa | $800,000 | -- | |
| 12 Elm Development | $225,000 | -- |
Source: Public Records
Mortgage History
| Date | Status | Borrower | Loan Amount |
|---|---|---|---|
| Open | Elm Road Industrial Pa | $640,000 |
Source: Public Records
Tax History Compared to Growth
Tax History
| Year | Tax Paid | Tax Assessment Tax Assessment Total Assessment is a certain percentage of the fair market value that is determined by local assessors to be the total taxable value of land and additions on the property. | Land | Improvement |
|---|---|---|---|---|
| 2024 | $12,247 | $956,800 | $390,000 | $566,800 |
| 2023 | $11,912 | $956,800 | $390,000 | $566,800 |
| 2022 | $13,602 | $792,200 | $300,500 | $491,700 |
| 2021 | $13,127 | $792,200 | $300,500 | $491,700 |
| 2020 | $13,396 | $792,200 | $300,500 | $491,700 |
| 2019 | $13,230 | $792,200 | $300,500 | $491,700 |
| 2018 | $12,865 | $792,200 | $300,500 | $491,700 |
| 2017 | $13,760 | $743,800 | $300,500 | $443,300 |
| 2016 | $13,232 | $743,800 | $300,500 | $443,300 |
| 2015 | $13,002 | $743,800 | $300,500 | $443,300 |
| 2014 | $12,682 | $743,800 | $300,500 | $443,300 |
| 2013 | $12,459 | $743,800 | $300,500 | $443,300 |
Source: Public Records
Map
Nearby Homes
- 3 Birch Rd
- 12345 Lafayette Rd
- 3549 Lafayette Rd
- 10 Elm Rd
- 108 Lafayette Rd
- 2 Birch Rd
- 20 Elm Rd
- 104 Lafayette Rd
- 116 Lafayette Rd
- 8 Elm Rd
- 10 Birch Rd
- 118 Lafayette Rd Unit Southerly Building
- 6 Woodknoll Dr
- 121 Lafayette Rd
- 6 Elm Rd
- 19 Birch Rd
- 111 Lafayette Rd
- 4 Woodknoll Dr
- 115 Shel Al Mobile Estates
- 16 Woodridge Ln