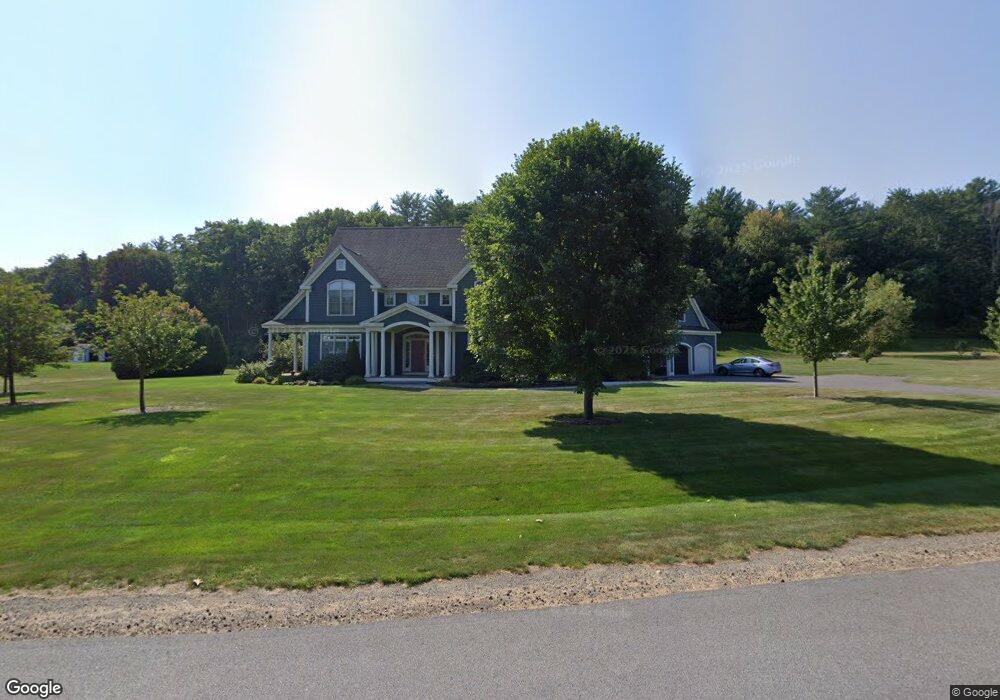
12 Evergreen Dr North Hampton, NH 03862
Estimated Value: $1,343,000 - $1,913,000
4
Beds
4
Baths
4,830
Sq Ft
$345/Sq Ft
Est. Value
About This Home
This home is located at 12 Evergreen Dr, North Hampton, NH 03862 and is currently estimated at $1,665,141, approximately $344 per square foot. 12 Evergreen Dr is a home located in Rockingham County with nearby schools including North Hampton School, Winnacunnet High School, and Acorn School.
Ownership History
Date
Name
Owned For
Owner Type
Purchase Details
Closed on
Apr 26, 2011
Sold by
Port City Development
Bought by
Sununu James G and Sununu Linneham-Sununu C
Current Estimated Value
Home Financials for this Owner
Home Financials are based on the most recent Mortgage that was taken out on this home.
Original Mortgage
$140,000
Interest Rate
4.9%
Mortgage Type
Purchase Money Mortgage
Purchase Details
Closed on
Mar 11, 2004
Sold by
Evergreen Dr Of The
Bought by
Mist Dev Llc
Home Financials for this Owner
Home Financials are based on the most recent Mortgage that was taken out on this home.
Original Mortgage
$407,000
Interest Rate
5.67%
Mortgage Type
Purchase Money Mortgage
Purchase Details
Closed on
Jan 30, 2001
Sold by
Second Story Homes Inc
Bought by
Aubin David A and Aubin Laura J
Create a Home Valuation Report for This Property
The Home Valuation Report is an in-depth analysis detailing your home's value as well as a comparison with similar homes in the area
Home Values in the Area
Average Home Value in this Area
Purchase History
| Date | Buyer | Sale Price | Title Company |
|---|---|---|---|
| Sununu James G | $200,000 | -- | |
| Mist Dev Llc | $167,500 | -- | |
| Aubin David A | $428,000 | -- |
Source: Public Records
Mortgage History
| Date | Status | Borrower | Loan Amount |
|---|---|---|---|
| Open | Aubin David A | $774,000 | |
| Closed | Aubin David A | $851,200 | |
| Closed | Aubin David A | $140,000 | |
| Previous Owner | Aubin David A | $407,000 |
Source: Public Records
Tax History Compared to Growth
Tax History
| Year | Tax Paid | Tax Assessment Tax Assessment Total Assessment is a certain percentage of the fair market value that is determined by local assessors to be the total taxable value of land and additions on the property. | Land | Improvement |
|---|---|---|---|---|
| 2024 | $17,800 | $1,390,600 | $455,300 | $935,300 |
| 2023 | $17,313 | $1,390,600 | $455,300 | $935,300 |
| 2022 | $15,201 | $885,300 | $246,300 | $639,000 |
| 2021 | $14,669 | $885,300 | $246,300 | $639,000 |
| 2020 | $14,970 | $885,300 | $246,300 | $639,000 |
| 2019 | $14,785 | $885,300 | $246,300 | $639,000 |
| 2018 | $14,377 | $885,300 | $246,300 | $639,000 |
| 2017 | $14,826 | $801,400 | $221,600 | $579,800 |
| 2016 | $14,257 | $801,400 | $221,600 | $579,800 |
| 2015 | $14,008 | $801,400 | $221,600 | $579,800 |
| 2014 | $13,664 | $801,400 | $221,600 | $579,800 |
| 2013 | $13,423 | $801,400 | $221,600 | $579,800 |
Source: Public Records
Map
Nearby Homes
- 10 Evergreen Dr
- 15 Evergreen Dr
- 13 Evergreen Dr
- 14 Evergreen Dr
- 8 Evergreen Dr
- 11 Evergreen Dr
- 17 Woodknoll Dr
- 8 Birch Rd
- 17 Evergreen Dr
- 7 Evergreen Dr
- 84 North Rd
- 9 Evergreen Dr
- 6 Evergreen Dr
- 15 Cherry Rd
- 16A Woodknoll Dr
- 16 Woodknoll Dr
- 19 Woodknoll Dr
- 5 Evergreen Dr
- 16 Evergreen Dr
- 18 Woodknoll Dr