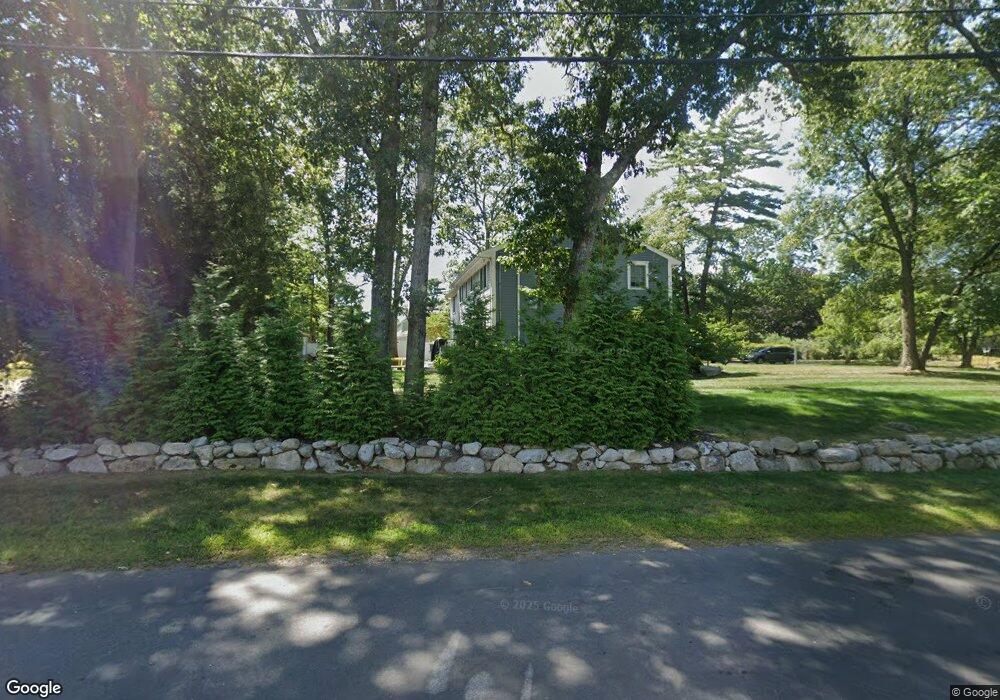
12 Peter Hobart Dr Hingham, MA 02043
South Hingham NeighborhoodEstimated Value: $1,020,000 - $1,349,667
4
Beds
2
Baths
2,356
Sq Ft
$502/Sq Ft
Est. Value
About This Home
This home is located at 12 Peter Hobart Dr, Hingham, MA 02043 and is currently estimated at $1,182,917, approximately $502 per square foot. 12 Peter Hobart Dr is a home located in Plymouth County with nearby schools including South Elementary School, Hingham Middle School, and Hingham High School.
Ownership History
Date
Name
Owned For
Owner Type
Purchase Details
Closed on
Sep 13, 2005
Sold by
Francis Pamela A
Bought by
Klein Scott D and Klein Elizabeth F
Current Estimated Value
Purchase Details
Closed on
Aug 24, 2004
Sold by
Francis Michael B and Francis Pamela A
Bought by
Francis Pamela A
Purchase Details
Closed on
May 30, 2001
Sold by
Oshaughnessy James P and Oshaughnessy Christine
Bought by
Francis Michael B and Francis Pamela A
Home Financials for this Owner
Home Financials are based on the most recent Mortgage that was taken out on this home.
Original Mortgage
$330,000
Interest Rate
7.09%
Mortgage Type
Purchase Money Mortgage
Purchase Details
Closed on
Jan 2, 1997
Sold by
Watson David T
Bought by
Oshaughnessy James P and Oshaughnessy Christine
Create a Home Valuation Report for This Property
The Home Valuation Report is an in-depth analysis detailing your home's value as well as a comparison with similar homes in the area
Home Values in the Area
Average Home Value in this Area
Purchase History
| Date | Buyer | Sale Price | Title Company |
|---|---|---|---|
| Klein Scott D | $575,000 | -- | |
| Francis Pamela A | -- | -- | |
| Francis Michael B | $439,000 | -- | |
| Oshaughnessy James P | $260,000 | -- |
Source: Public Records
Mortgage History
| Date | Status | Borrower | Loan Amount |
|---|---|---|---|
| Open | Oshaughnessy James P | $320,000 | |
| Previous Owner | Oshaughnessy James P | $275,000 | |
| Previous Owner | Oshaughnessy James P | $330,000 |
Source: Public Records
Tax History
| Year | Tax Paid | Tax Assessment Tax Assessment Total Assessment is a certain percentage of the fair market value that is determined by local assessors to be the total taxable value of land and additions on the property. | Land | Improvement |
|---|---|---|---|---|
| 2025 | $12,301 | $1,150,700 | $455,300 | $695,400 |
| 2024 | $11,817 | $1,089,100 | $455,300 | $633,800 |
| 2023 | $10,308 | $1,030,800 | $455,300 | $575,500 |
| 2022 | $9,365 | $810,100 | $351,400 | $458,700 |
| 2021 | $9,189 | $778,700 | $351,400 | $427,300 |
| 2020 | $8,978 | $778,700 | $351,400 | $427,300 |
| 2019 | $7,411 | $627,500 | $351,400 | $276,100 |
| 2018 | $7,093 | $602,600 | $351,400 | $251,200 |
| 2017 | $6,953 | $567,600 | $359,000 | $208,600 |
| 2016 | $6,876 | $550,500 | $341,900 | $208,600 |
| 2015 | $6,696 | $534,400 | $325,800 | $208,600 |
Source: Public Records
Map
Nearby Homes
- 100 Whiting St
- 183 Gardner St
- 18 Whiting Ln
- 4 Kerri Ln
- 1 Kerri Ln
- 17 Pine Haven Cir
- 5 Old County Rd
- 18 Colby St
- 55 Turner Rd
- 22 Longmeadow Rd
- 8 Blueberry Ct
- 5 Blueberry Ct
- 214 Washington St Unit 24
- 214 Washington St Unit 28
- 17 Elizabeth Ln Unit 17
- 15 Elizabeth Ln Unit 15
- 13 Elizabeth Ln Unit 13
- 9 Elizabeth Ln Unit 9
- 7 Elizabeth Ln Unit 7
- 5 Elizabeth Ln Unit 5
- 14 Peter Hobart Dr
- 9 Peter Hobart Dr
- 5 Peter Hobart Dr
- 3 Peter Hobart Dr
- 6 Peter Hobart Dr
- 16 Peter Hobart Dr
- 15 Peter Hobart Dr
- 4 Peter Hobart Dr
- 17 Peter Hobart Dr
- 244 Gardner St
- 238 Gardner St
- 18 Peter Hobart Dr
- 167 Whiting St
- 248 Gardner St
- 19 Peter Hobart Dr
- 19 Peter Hobart Dr
- 286 Gardner St
- 173 Whiting St
- 150 Whiting St
- 188 Whiting St Unit 102
Your Personal Tour Guide
Ask me questions while you tour the home.