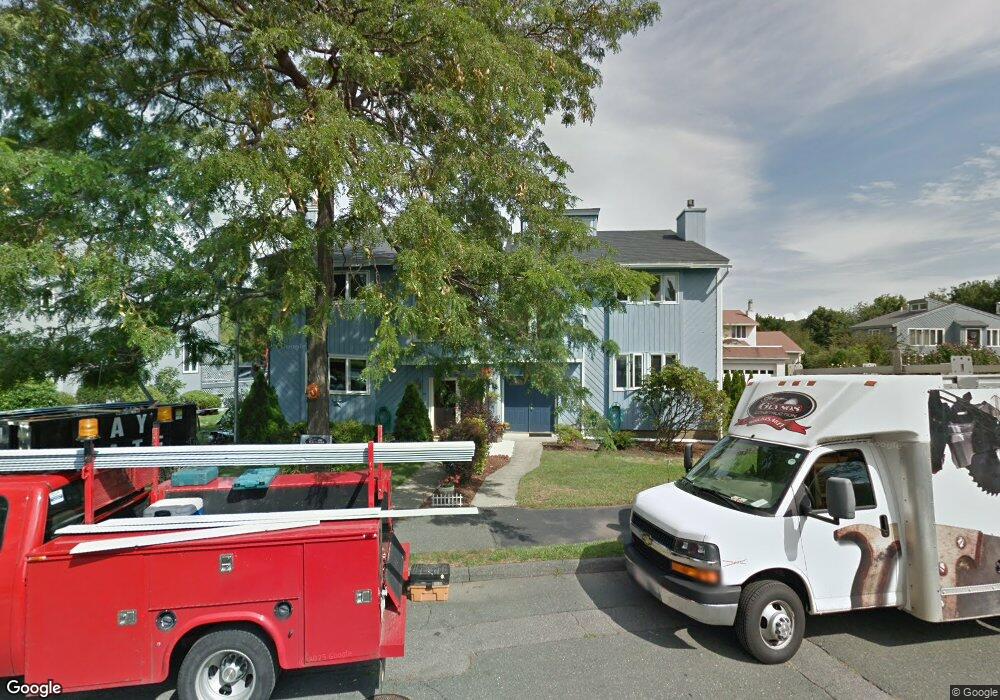
12 Sutton Place Swampscott, MA 01907
Estimated Value: $716,000 - $985,000
3
Beds
3
Baths
7,688
Sq Ft
$106/Sq Ft
Est. Value
About This Home
This home is located at 12 Sutton Place, Swampscott, MA 01907 and is currently estimated at $812,342, approximately $105 per square foot. 12 Sutton Place is a home located in Essex County with nearby schools including Swampscott Middle School and Swampscott High School.
Ownership History
Date
Name
Owned For
Owner Type
Purchase Details
Closed on
Dec 7, 2021
Sold by
Struzziero Robert A
Bought by
Francis Nandi J and Francis Patrice T
Current Estimated Value
Home Financials for this Owner
Home Financials are based on the most recent Mortgage that was taken out on this home.
Original Mortgage
$596,700
Outstanding Balance
$549,028
Interest Rate
3.14%
Mortgage Type
Purchase Money Mortgage
Estimated Equity
$263,314
Purchase Details
Closed on
Oct 8, 2021
Sold by
M E Struzziero Irt
Bought by
Struzziero Robert A
Home Financials for this Owner
Home Financials are based on the most recent Mortgage that was taken out on this home.
Original Mortgage
$596,700
Outstanding Balance
$549,028
Interest Rate
3.14%
Mortgage Type
Purchase Money Mortgage
Estimated Equity
$263,314
Purchase Details
Closed on
Mar 21, 2013
Sold by
Struzzerio Robert A
Bought by
Marie E Struzziero Irt
Purchase Details
Closed on
Aug 18, 1977
Bought by
Marie E Struzziero Irt
Create a Home Valuation Report for This Property
The Home Valuation Report is an in-depth analysis detailing your home's value as well as a comparison with similar homes in the area
Home Values in the Area
Average Home Value in this Area
Purchase History
| Date | Buyer | Sale Price | Title Company |
|---|---|---|---|
| Francis Nandi J | $663,000 | None Available | |
| Struzziero Robert A | -- | None Available | |
| Marie E Struzziero Irt | -- | -- | |
| Marie E Struzziero Irt | -- | -- |
Source: Public Records
Mortgage History
| Date | Status | Borrower | Loan Amount |
|---|---|---|---|
| Open | Francis Nandi J | $596,700 | |
| Previous Owner | Marie E Struzziero Irt | $65,000 | |
| Previous Owner | Marie E Struzziero Irt | $30,000 | |
| Previous Owner | Marie E Struzziero Irt | $25,000 |
Source: Public Records
Tax History Compared to Growth
Tax History
| Year | Tax Paid | Tax Assessment Tax Assessment Total Assessment is a certain percentage of the fair market value that is determined by local assessors to be the total taxable value of land and additions on the property. | Land | Improvement |
|---|---|---|---|---|
| 2025 | $7,692 | $670,600 | $0 | $670,600 |
| 2024 | $7,517 | $654,200 | $0 | $654,200 |
| 2023 | $7,302 | $622,000 | $0 | $622,000 |
| 2022 | $7,384 | $575,500 | $0 | $575,500 |
| 2021 | $7,473 | $541,500 | $0 | $541,500 |
| 2020 | $6,863 | $479,900 | $0 | $479,900 |
| 2019 | $7,294 | $479,900 | $0 | $479,900 |
| 2018 | $7,166 | $447,900 | $0 | $447,900 |
| 2017 | $7,397 | $423,900 | $0 | $423,900 |
| 2016 | $7,085 | $408,800 | $0 | $408,800 |
| 2015 | $6,517 | $380,000 | $0 | $380,000 |
| 2014 | $6,807 | $364,000 | $0 | $364,000 |
Source: Public Records
Map
Nearby Homes
- 21 Bay View Dr
- 8 Ocean View Rd
- 13 Cedar Hill Terrace Unit 2
- 75 Bay View Dr
- 71 Greenwood Ave Unit 207
- 110 Galloupes Point Rd
- 35 Alden Rd
- 71 Walnut Rd
- 140 Elmwood Rd
- 24 Orchard Cir
- 35 Littles Point Rd Unit S201
- 309 Paradise Rd
- 28 Claremont Terrace Unit 4
- 28 Claremont Terrace Unit 6
- 306 Paradise Rd
- 98 Paradise Rd
- 108-110 Burrill St Unit 1
- 30 Paradise Rd
- 7-9 Rock Ave
- 106 Norfolk Ave
- 14 Sutton Place
- 12 Sutton Place
- 14 Sutton Place Unit 14
- 14 Sutton Place Unit 1
- 8 Sutton Place
- 10 Sutton Place
- 16 Sutton Place
- 15 Sutton Place
- 11 Sutton Place
- 11 Sutton Place Unit 1
- 11 Sutton Place Unit 11
- 13 Sutton Place
- 9 Sutton Place
- 9 Sutton Place Unit 9
- 4 Sutton Place
- 4 Sutton Place Unit 4
- 6 Sutton Place
- 6 Sutton Place Unit 6
- 6 Sutton Place Unit B
- 7 Sutton Place