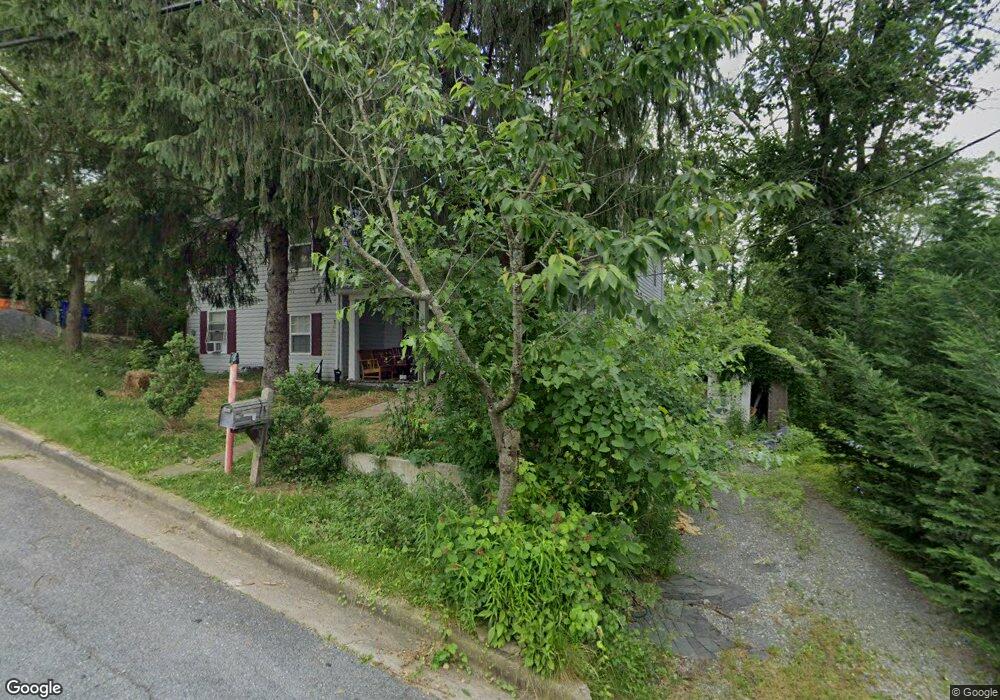
12 W E St Brunswick, MD 21716
Estimated Value: $280,000 - $318,270
Studio
2
Baths
1,248
Sq Ft
$242/Sq Ft
Est. Value
About This Home
This home is located at 12 W E St, Brunswick, MD 21716 and is currently estimated at $301,568, approximately $241 per square foot. 12 W E St is a home located in Frederick County with nearby schools including Brunswick Elementary School, Brunswick Middle School, and Brunswick High School.
Ownership History
Date
Name
Owned For
Owner Type
Purchase Details
Closed on
Nov 20, 2000
Sold by
Beach Kristen Lynn
Bought by
Tyman Catherine H
Current Estimated Value
Purchase Details
Closed on
May 7, 1996
Sold by
Assoc Relocation Manag Co Inc
Bought by
Beach Kristen Lynn
Purchase Details
Closed on
Feb 22, 1996
Sold by
Ubbelohde Robert J and Ubbelohde Deborah
Bought by
Assoc Relocation Manag Co Inc
Create a Home Valuation Report for This Property
The Home Valuation Report is an in-depth analysis detailing your home's value as well as a comparison with similar homes in the area
Home Values in the Area
Average Home Value in this Area
Purchase History
| Date | Buyer | Sale Price | Title Company |
|---|---|---|---|
| Tyman Catherine H | $129,500 | -- | |
| Beach Kristen Lynn | $94,500 | -- | |
| Assoc Relocation Manag Co Inc | $96,000 | -- |
Source: Public Records
Mortgage History
| Date | Status | Borrower | Loan Amount |
|---|---|---|---|
| Closed | Beach Kristen Lynn | -- |
Source: Public Records
Tax History
| Year | Tax Paid | Tax Assessment Tax Assessment Total Assessment is a certain percentage of the fair market value that is determined by local assessors to be the total taxable value of land and additions on the property. | Land | Improvement |
|---|---|---|---|---|
| 2025 | $3,324 | $238,500 | -- | -- |
| 2024 | $3,324 | $222,500 | $89,200 | $133,300 |
| 2023 | $3,072 | $208,367 | $0 | $0 |
| 2022 | $2,925 | $194,233 | $0 | $0 |
| 2021 | $2,654 | $180,100 | $62,800 | $117,300 |
| 2020 | $2,654 | $169,567 | $0 | $0 |
| 2019 | $2,529 | $159,033 | $0 | $0 |
| 2018 | $2,452 | $148,500 | $45,200 | $103,300 |
| 2017 | $2,422 | $148,500 | $0 | $0 |
| 2016 | $2,525 | $146,433 | $0 | $0 |
| 2015 | $2,525 | $145,400 | $0 | $0 |
| 2014 | $2,525 | $145,400 | $0 | $0 |
Source: Public Records
Map
Nearby Homes
- 0 E D St Unit MDFR2057714
- 519 N Maple Ave
- 7 W B St
- 37 E C St
- 22 N Virginia Ave
- 15 N Maryland Ave
- 8 N Virginia Ave
- 801 N Maple Ave
- 8 S Maple Ave
- 0 E Potomac St Unit MDFR2078442
- 505 4th Ave
- TBB Shenandoah View Pkwy Unit ORCHID
- Homesite 232 Potomac View Pkwy
- 234 Potomac View Pkwy
- 21 W Orndorff Dr
- 812 Kaplon Ct
- 805 E B St
- 9 9th Ave
- 411 9th Ave
- 926 E A St
Your Personal Tour Guide
Ask me questions while you tour the home.