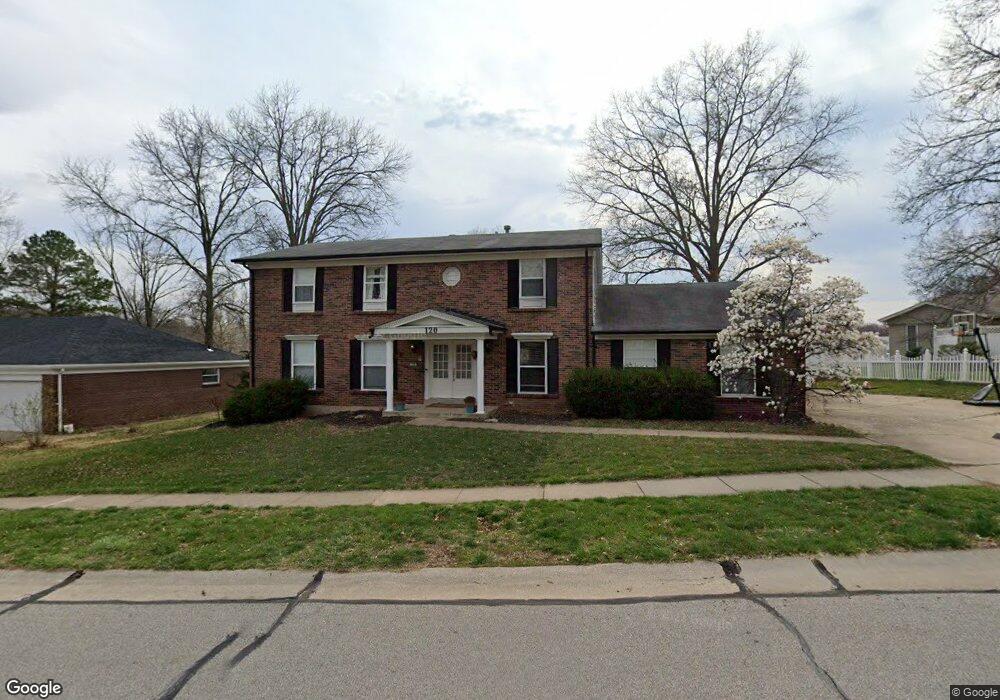
120 Clear Meadows Dr Ballwin, MO 63011
Estimated Value: $524,266 - $621,000
6
Beds
5
Baths
3,188
Sq Ft
$174/Sq Ft
Est. Value
About This Home
This home is located at 120 Clear Meadows Dr, Ballwin, MO 63011 and is currently estimated at $553,317, approximately $173 per square foot. 120 Clear Meadows Dr is a home located in St. Louis County with nearby schools including Claymont Elementary School, Parkway West Middle School, and Parkway West High School.
Ownership History
Date
Name
Owned For
Owner Type
Purchase Details
Closed on
May 23, 2016
Sold by
Burford Benton E and Burford Jennifer
Bought by
Burford Benton E and Burford Jennifer
Current Estimated Value
Home Financials for this Owner
Home Financials are based on the most recent Mortgage that was taken out on this home.
Original Mortgage
$288,000
Outstanding Balance
$178,823
Interest Rate
3.59%
Mortgage Type
New Conventional
Estimated Equity
$374,494
Purchase Details
Closed on
Oct 8, 2012
Sold by
Glastris Bess V
Bought by
Burford Benton E
Home Financials for this Owner
Home Financials are based on the most recent Mortgage that was taken out on this home.
Original Mortgage
$286,171
Interest Rate
3.75%
Mortgage Type
FHA
Purchase Details
Closed on
Aug 8, 2005
Sold by
Glastris Bess V
Bought by
The Bess V Glastris Revocable Living Tr
Create a Home Valuation Report for This Property
The Home Valuation Report is an in-depth analysis detailing your home's value as well as a comparison with similar homes in the area
Home Values in the Area
Average Home Value in this Area
Purchase History
| Date | Buyer | Sale Price | Title Company |
|---|---|---|---|
| Burford Benton E | -- | Title Partners Agency Llc | |
| Burford Benton E | $240,000 | It | |
| The Bess V Glastris Revocable Living Tr | -- | -- |
Source: Public Records
Mortgage History
| Date | Status | Borrower | Loan Amount |
|---|---|---|---|
| Open | Burford Benton E | $288,000 | |
| Closed | Burford Benton E | $286,171 |
Source: Public Records
Tax History
| Year | Tax Paid | Tax Assessment Tax Assessment Total Assessment is a certain percentage of the fair market value that is determined by local assessors to be the total taxable value of land and additions on the property. | Land | Improvement |
|---|---|---|---|---|
| 2025 | $5,288 | $81,680 | $28,610 | $53,070 |
| 2024 | $5,288 | $81,720 | $22,950 | $58,770 |
| 2023 | $5,214 | $81,720 | $22,950 | $58,770 |
| 2022 | $5,625 | $80,180 | $22,950 | $57,230 |
| 2021 | $5,592 | $80,180 | $22,950 | $57,230 |
| 2020 | $4,856 | $65,930 | $19,060 | $46,870 |
| 2019 | $4,801 | $65,930 | $19,060 | $46,870 |
| 2018 | $4,784 | $60,960 | $17,160 | $43,800 |
| 2017 | $4,648 | $60,960 | $17,160 | $43,800 |
| 2016 | $4,131 | $51,510 | $12,430 | $39,080 |
Source: Public Records
Map
Nearby Homes
- 114 Lea Meadows Dr
- 277 Oak Path Dr
- 202 Wildbrier Dr
- 203 Morewood Dr
- 351 Champion Way Dr
- 548 Windsor Mill Dr
- 490 Maymont Dr
- 500 Kingridge Dr
- 212 Lakeside Dr
- 505 Glenmeadow Dr
- 449 Wildwood Pkwy
- 521 Kehrs Mill Rd
- 323 Chipley Cir
- 107 Falmouth Dr
- 312 Ballwin Ave
- 569 Highland Ridge Dr
- 103 Denbigh Terrace
- 426 Brooktree Dr
- 421 Andover Ln
- 103 Calico Ln
- 118 Clear Meadows Dr
- 312 High Meadows Dr
- 308 High Meadows Dr
- 309 Bright Meadows Dr
- 306 High Meadows Dr
- 115 Clear Meadows Dr
- 117 Clear Meadows Dr
- 113 Clear Meadows Dr
- 119 Clear Meadows Dr
- 307 Bright Meadows Dr
- 304 High Meadows Dr
- 111 Clear Meadows Dr
- 306 Bright Meadows Dr
- 309 High Meadows Dr
- 124 Clear Meadows Dr
- 307 High Meadows Dr
- 121 Clear Meadows Dr
- 304 Bright Meadows Dr
- 112 Lea Meadows Dr
- 305 High Meadows Dr
Your Personal Tour Guide
Ask me questions while you tour the home.