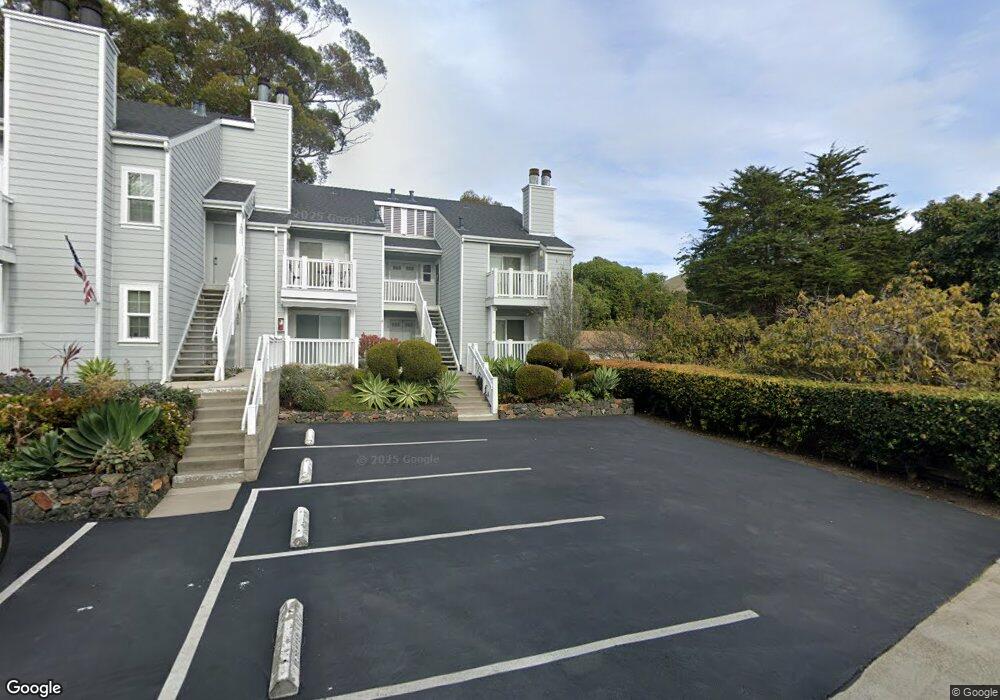
120 Cypress Ave Cayucos, CA 93430
Cayucos NeighborhoodEstimated Value: $620,300 - $927,000
2
Beds
1
Bath
700
Sq Ft
$1,106/Sq Ft
Est. Value
About This Home
This home is located at 120 Cypress Ave, Cayucos, CA 93430 and is currently estimated at $774,075, approximately $1,105 per square foot. 120 Cypress Ave is a home located in San Luis Obispo County.
Ownership History
Date
Name
Owned For
Owner Type
Purchase Details
Closed on
Feb 23, 2021
Sold by
Chambers Roberta F
Bought by
Chambers Roberta F and 2021 Roberta Frances
Current Estimated Value
Purchase Details
Closed on
Sep 17, 2007
Sold by
Chambers John B and Chambers Roberta F
Bought by
Chambers John B and Chambers Roberta F
Purchase Details
Closed on
Jan 16, 1996
Sold by
Arnold Nancy
Bought by
Chambers John B and Chambers Roberta F
Home Financials for this Owner
Home Financials are based on the most recent Mortgage that was taken out on this home.
Original Mortgage
$108,000
Outstanding Balance
$2,861
Interest Rate
7.1%
Estimated Equity
$771,214
Purchase Details
Closed on
May 4, 1994
Sold by
Ford Carolynn Valdes and Poncetta Carolyn
Bought by
Arnold Nancy
Home Financials for this Owner
Home Financials are based on the most recent Mortgage that was taken out on this home.
Original Mortgage
$104,800
Interest Rate
8.6%
Create a Home Valuation Report for This Property
The Home Valuation Report is an in-depth analysis detailing your home's value as well as a comparison with similar homes in the area
Home Values in the Area
Average Home Value in this Area
Purchase History
| Date | Buyer | Sale Price | Title Company |
|---|---|---|---|
| Chambers Roberta F | -- | None Available | |
| Chambers John B | -- | None Available | |
| Chambers John B | $135,000 | Chicago Title Co | |
| Arnold Nancy | $131,000 | Ticor Title Insurance Compan |
Source: Public Records
Mortgage History
| Date | Status | Borrower | Loan Amount |
|---|---|---|---|
| Open | Chambers John B | $108,000 | |
| Previous Owner | Arnold Nancy | $104,800 | |
| Closed | Arnold Nancy | $13,100 |
Source: Public Records
Tax History
| Year | Tax Paid | Tax Assessment Tax Assessment Total Assessment is a certain percentage of the fair market value that is determined by local assessors to be the total taxable value of land and additions on the property. | Land | Improvement |
|---|---|---|---|---|
| 2025 | $2,436 | $224,235 | $107,964 | $116,271 |
| 2024 | $2,407 | $219,840 | $105,848 | $113,992 |
| 2023 | $2,407 | $215,530 | $103,773 | $111,757 |
| 2022 | $2,365 | $211,305 | $101,739 | $109,566 |
| 2021 | $2,326 | $207,163 | $99,745 | $107,418 |
| 2020 | $2,301 | $205,040 | $98,723 | $106,317 |
| 2019 | $2,256 | $201,021 | $96,788 | $104,233 |
| 2018 | $2,211 | $197,081 | $94,891 | $102,190 |
| 2017 | $2,166 | $193,218 | $93,031 | $100,187 |
| 2016 | $2,123 | $189,430 | $91,207 | $98,223 |
| 2015 | $2,104 | $186,585 | $89,837 | $96,748 |
| 2014 | $2,032 | $182,931 | $88,078 | $94,853 |
Source: Public Records
Map
Nearby Homes
- 130 Cypress Ave
- 340 D St
- 159 Ash Ave
- 0 Ash Ave Unit SC25116716
- 77 N Ocean Ave Unit 8
- 77 N Ocean Ave Unit 12
- 191 J St
- 349 N Ocean Ave Unit A13
- 349 N Ocean Ave Unit A3
- 31 N 3rd St
- 50 S 3rd St
- 510 Park Ave
- 557 Lucerne St
- 1000 Saint Mary Ave
- 29 11th St
- 1234 Pacific Ave
- 1625 Cass Ave Unit 22
- 1155 Cayucos Creek Rd
- 2023 Circle Dr
- 96 24th St
- 122 Cypress Ave
- 126 Cypress Ave
- 124 Cypress Ave
- 128 Cypress Ave
- 130 Cypress Ave Unit 22
- 481 D St
- 164 Cypress Ave
- 176 Cypress Ave
- 441 D St
- 140 Cypress Ave
- 142 Cypress Ave
- 146 Cypress Ave Unit 29
- 146 Cypress Ave
- 144 Cypress Ave
- 150 Cypress Ave
- 148 Cypress Ave Unit 25
- 150 Cypress Ave Unit 28
- 150 Cypress Ave
- 148 Cypress Ave
- 411 D St
Your Personal Tour Guide
Ask me questions while you tour the home.