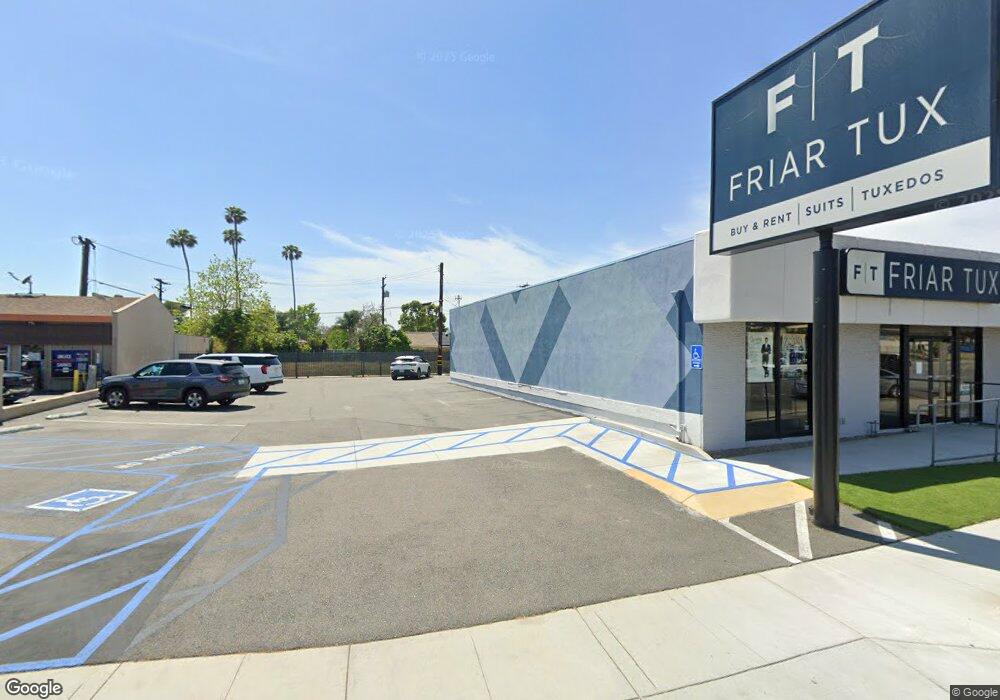
120 N Tustin St Orange, CA 92867
Estimated Value: $1,446,726
--
Bed
--
Bath
2,112
Sq Ft
$685/Sq Ft
Est. Value
About This Home
This home is located at 120 N Tustin St, Orange, CA 92867 and is currently estimated at $1,446,726, approximately $685 per square foot. 120 N Tustin St is a home located in Orange County with nearby schools including Cambridge Elementary School, Yorba Middle School, and Orange High School.
Ownership History
Date
Name
Owned For
Owner Type
Purchase Details
Closed on
Aug 21, 2017
Sold by
Meskell Goodwin & Meskell Llc
Bought by
City Of Orange
Current Estimated Value
Purchase Details
Closed on
Jun 20, 2008
Sold by
Msg
Bought by
Meskell Goodwin & Meskell Llc
Purchase Details
Closed on
Mar 19, 1999
Sold by
Neggen Christian Victor and Mcglone Richard B
Bought by
Msg Partners
Home Financials for this Owner
Home Financials are based on the most recent Mortgage that was taken out on this home.
Original Mortgage
$240,000
Interest Rate
7.96%
Mortgage Type
Seller Take Back
Create a Home Valuation Report for This Property
The Home Valuation Report is an in-depth analysis detailing your home's value as well as a comparison with similar homes in the area
Home Values in the Area
Average Home Value in this Area
Purchase History
| Date | Buyer | Sale Price | Title Company |
|---|---|---|---|
| City Of Orange | -- | Ticor Title Co Of California | |
| Meskell Goodwin & Meskell Llc | -- | None Available | |
| Msg Partners | $300,000 | North American Title Co |
Source: Public Records
Mortgage History
| Date | Status | Borrower | Loan Amount |
|---|---|---|---|
| Previous Owner | Msg Partners | $240,000 |
Source: Public Records
Tax History Compared to Growth
Tax History
| Year | Tax Paid | Tax Assessment Tax Assessment Total Assessment is a certain percentage of the fair market value that is determined by local assessors to be the total taxable value of land and additions on the property. | Land | Improvement |
|---|---|---|---|---|
| 2025 | $5,170 | $461,080 | $276,655 | $184,425 |
| 2024 | $5,170 | $452,040 | $271,231 | $180,809 |
| 2023 | $5,055 | $443,177 | $265,913 | $177,264 |
| 2022 | $4,956 | $434,488 | $260,699 | $173,789 |
| 2021 | $4,820 | $425,969 | $255,587 | $170,382 |
| 2020 | $4,775 | $421,602 | $252,967 | $168,635 |
| 2019 | $4,717 | $413,336 | $248,007 | $165,329 |
| 2018 | $4,645 | $405,232 | $243,144 | $162,088 |
| 2017 | $4,456 | $397,287 | $238,377 | $158,910 |
| 2016 | $4,371 | $389,498 | $233,703 | $155,795 |
| 2015 | $4,307 | $383,648 | $230,193 | $153,455 |
| 2014 | $4,216 | $376,133 | $225,683 | $150,450 |
Source: Public Records
Map
Nearby Homes
- 1514 E Palm Ave
- 316 N Shattuck Place
- 1904 E Palm Ave
- 415 N Wayfield St
- 360 S Greengrove Dr
- 234 N Milford St
- 1916 1920 E Kirkwood
- 1144 E Madison Ave
- 547 E Washington Ave
- 280 N Cleveland St
- 1105 E Rose Ave
- 1024 E Tularosa Ave
- 528 E Palmyra Ave
- 2515 E Orange Grove Ave
- 641 N Milford St
- 707 E Tularosa Ave
- 308 S Craig Dr
- 2705 E Orange Grove Ave
- 1316 E Lomita Ave
- 1040 E Oakmont Ave
- 1617 E Chapman Ave
- 125 N Tustin St Unit E
- 125 N Tustin St
- 172 N Tustin St Unit 203
- 137 N Shattuck Place
- 127 N Shattuck Place
- 147 N Shattuck Place
- 157 N Shattuck Place
- 167 N Shattuck Place
- 169 N Shattuck Place
- 177 N Shattuck Place
- 187 N Shattuck Place
- 1519 E Chapman Ave
- 136 N Shattuck Place
- 126 N Shattuck Place
- 146 N Shattuck Place
- 201 N Shattuck Place
- 1509 E Chapman Ave
- 156 N Shattuck Place
- 166 N Shattuck Place