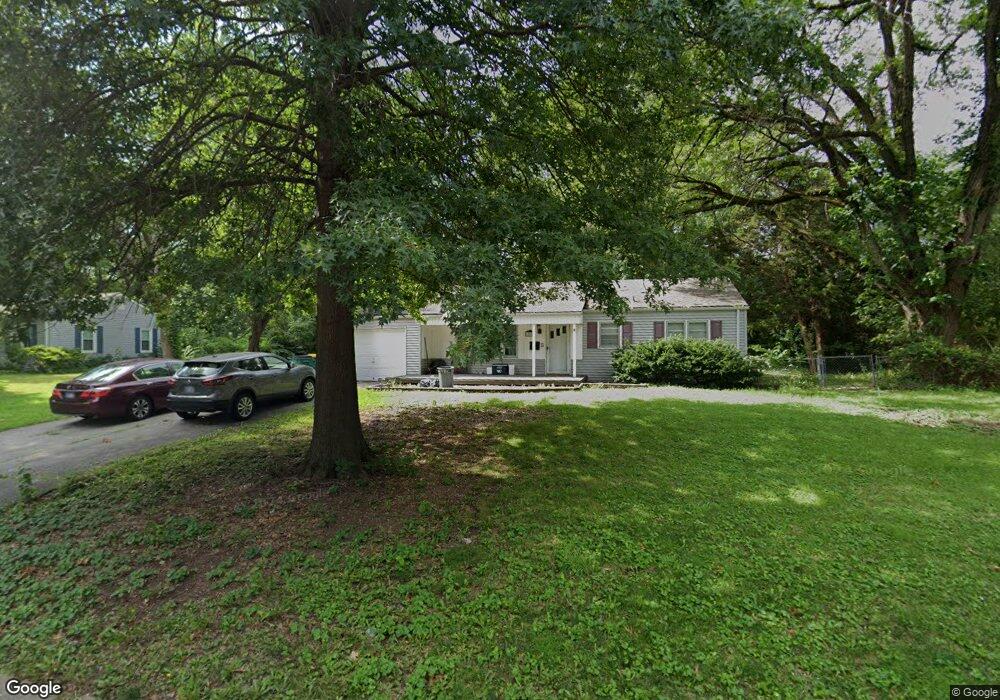
12011 W 60th Place Shawnee, KS 66216
Estimated Value: $239,000 - $279,000
3
Beds
1
Bath
1,056
Sq Ft
$248/Sq Ft
Est. Value
About This Home
This home is located at 12011 W 60th Place, Shawnee, KS 66216 and is currently estimated at $261,412, approximately $247 per square foot. 12011 W 60th Place is a home located in Johnson County with nearby schools including Bluejacket / Flint Elementary, Hocker Grove Middle School, and Shawnee Mission North High School.
Ownership History
Date
Name
Owned For
Owner Type
Purchase Details
Closed on
Jun 21, 2018
Sold by
Northrop Larry and Northrop Amy
Bought by
Northrop David and Northrop Kayla
Current Estimated Value
Purchase Details
Closed on
Jun 3, 2004
Sold by
Roche Nancy Diane
Bought by
Northrop Larry and Northrop David
Home Financials for this Owner
Home Financials are based on the most recent Mortgage that was taken out on this home.
Original Mortgage
$96,300
Interest Rate
6.02%
Mortgage Type
Unknown
Purchase Details
Closed on
Nov 21, 2002
Sold by
Roche Nancy Diane and Attebery Jeremy L
Bought by
Roche Nancy Diane and The Nancy Diane Roche Revocable Living T
Purchase Details
Closed on
May 29, 2002
Sold by
Roche Nancy D
Bought by
Roche Nancy D and Roche Elizabeth A
Home Financials for this Owner
Home Financials are based on the most recent Mortgage that was taken out on this home.
Original Mortgage
$35,000
Interest Rate
6.92%
Create a Home Valuation Report for This Property
The Home Valuation Report is an in-depth analysis detailing your home's value as well as a comparison with similar homes in the area
Home Values in the Area
Average Home Value in this Area
Purchase History
| Date | Buyer | Sale Price | Title Company |
|---|---|---|---|
| Northrop David | -- | Secured Title Inc | |
| Northrop Larry | -- | Chicago Title Insurance Comp | |
| Roche Nancy Diane | -- | -- | |
| Roche Nancy D | -- | Gold Title Agency |
Source: Public Records
Mortgage History
| Date | Status | Borrower | Loan Amount |
|---|---|---|---|
| Previous Owner | Northrop Larry | $96,300 | |
| Previous Owner | Roche Nancy D | $35,000 |
Source: Public Records
Tax History Compared to Growth
Tax History
| Year | Tax Paid | Tax Assessment Tax Assessment Total Assessment is a certain percentage of the fair market value that is determined by local assessors to be the total taxable value of land and additions on the property. | Land | Improvement |
|---|---|---|---|---|
| 2024 | $2,588 | $24,817 | $5,334 | $19,483 |
| 2023 | $2,647 | $24,771 | $5,334 | $19,437 |
| 2022 | $2,348 | $21,896 | $4,883 | $17,013 |
| 2021 | $2,348 | $19,780 | $4,245 | $15,535 |
| 2020 | $2,168 | $18,572 | $3,857 | $14,715 |
| 2019 | $1,976 | $16,894 | $3,218 | $13,676 |
| 2017 | $1,785 | $14,950 | $2,900 | $12,050 |
| 2016 | $1,571 | $12,972 | $2,900 | $10,072 |
Source: Public Records
Map
Nearby Homes
- 5845 Caenen St
- 12116 W 63rd Terrace
- 5620 Monrovia St
- 12809 W 57th Terrace
- 12225 W 64th Terrace
- 12508 W 56th St
- 5807 Noland Rd
- 4908 Noland Rd
- 5504 Monrovia St
- 6556 Charles St
- 6564 Charles St
- 6610 Halsey St
- 5407 Halsey St
- 5919 Pflumm Rd
- 11815 W 53rd St
- 12300 W 67th Terrace
- 11002 W 55th Terrace
- 6420 Ballentine St
- 11637 W 68th Terrace
- 13126 W 52nd Terrace
- 12101 W 60th Place
- 12009 W 60th Place
- 6102 Earnshaw St
- 6108 Earnshaw St
- 12012 W 60th Place
- 6107 Halsey St
- 12008 W 60th Place
- 12001 W 60th Place
- 12100 W 60th Place
- 6113 Halsey St
- 12109 W 60th Place
- 12000 W 60th Place
- 6103 Earnshaw St
- 12009 W 60th Terrace
- 12108 W 60th Place
- 12005 W 60th Terrace
- 12101 W 60th Terrace
- 11911 W 60th Place
- 12112 W 60th Place
- 6120 Earnshaw St