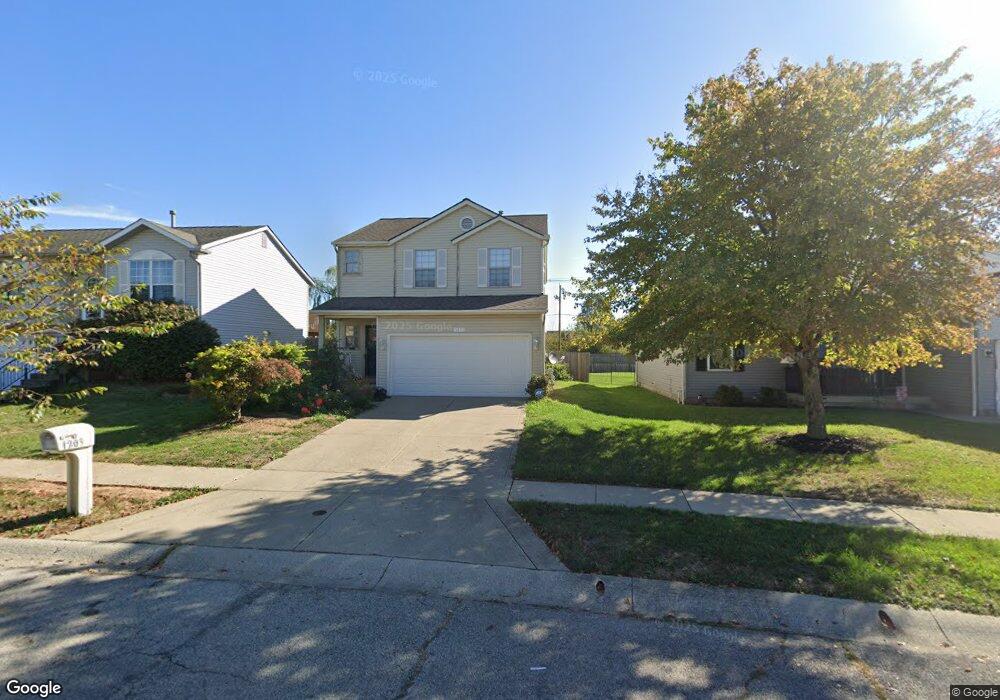
1203 Rendezvous Ln Columbus, OH 43207
Obetz-Lockbourne NeighborhoodEstimated Value: $277,738 - $328,000
3
Beds
3
Baths
1,606
Sq Ft
$186/Sq Ft
Est. Value
About This Home
This home is located at 1203 Rendezvous Ln, Columbus, OH 43207 and is currently estimated at $299,435, approximately $186 per square foot. 1203 Rendezvous Ln is a home located in Franklin County with nearby schools including Hamilton Intermediate School, Hamilton Elementary School, and Hamilton Middle School.
Ownership History
Date
Name
Owned For
Owner Type
Purchase Details
Closed on
Jan 16, 2009
Sold by
Pace Tony A and Pace Connie L
Bought by
Pace Tony A and Pace Connie L
Current Estimated Value
Purchase Details
Closed on
Dec 19, 2006
Sold by
Hogdon Theresa and Rendezvous Trust
Bought by
Pace Tony A and Pace Connie L
Home Financials for this Owner
Home Financials are based on the most recent Mortgage that was taken out on this home.
Original Mortgage
$118,454
Outstanding Balance
$70,664
Interest Rate
6.27%
Mortgage Type
FHA
Estimated Equity
$228,771
Purchase Details
Closed on
Apr 27, 2005
Sold by
Parkland Investment Group Llc
Bought by
Hogdon Theresa and Rendezvous Trust
Purchase Details
Closed on
Apr 20, 2005
Sold by
Richards Jonathon M
Bought by
Parkland Investment Group Llc
Purchase Details
Closed on
Mar 31, 2005
Sold by
Richards Jaime
Bought by
Richards Jonathon M
Purchase Details
Closed on
Dec 31, 1998
Sold by
Crossmann Communities Of Ohio Inc
Bought by
Tyree Ryan M and Childers Tyree Kim C
Purchase Details
Closed on
Jul 10, 1998
Sold by
Crossmann Communities Of Ohio Inc
Bought by
Moore Lisa E
Create a Home Valuation Report for This Property
The Home Valuation Report is an in-depth analysis detailing your home's value as well as a comparison with similar homes in the area
Home Values in the Area
Average Home Value in this Area
Purchase History
| Date | Buyer | Sale Price | Title Company |
|---|---|---|---|
| Pace Tony A | -- | Attorney | |
| Pace Tony A | $118,000 | Pillar Titl | |
| Hogdon Theresa | $92,000 | -- | |
| Parkland Investment Group Llc | $76,400 | -- | |
| Richards Jonathon M | -- | -- | |
| Tyree Ryan M | $110,000 | Chicago Title West | |
| Moore Lisa E | -- | -- |
Source: Public Records
Mortgage History
| Date | Status | Borrower | Loan Amount |
|---|---|---|---|
| Open | Pace Tony A | $118,454 |
Source: Public Records
Tax History Compared to Growth
Tax History
| Year | Tax Paid | Tax Assessment Tax Assessment Total Assessment is a certain percentage of the fair market value that is determined by local assessors to be the total taxable value of land and additions on the property. | Land | Improvement |
|---|---|---|---|---|
| 2024 | $3,318 | $86,070 | $21,630 | $64,440 |
| 2023 | $3,264 | $86,065 | $21,630 | $64,435 |
| 2022 | $2,102 | $50,370 | $8,330 | $42,040 |
| 2021 | $2,137 | $50,370 | $8,330 | $42,040 |
| 2020 | $2,186 | $50,370 | $8,330 | $42,040 |
| 2019 | $2,016 | $42,390 | $6,970 | $35,420 |
| 2018 | $1,908 | $42,390 | $6,970 | $35,420 |
| 2017 | $1,915 | $42,390 | $6,970 | $35,420 |
| 2016 | $1,790 | $34,790 | $6,230 | $28,560 |
| 2015 | $1,813 | $34,790 | $6,230 | $28,560 |
| 2014 | $1,819 | $34,790 | $6,230 | $28,560 |
| 2013 | $933 | $36,610 | $6,545 | $30,065 |
Source: Public Records
Map
Nearby Homes
- 1187 Rendezvous Ln
- 4451 1/2 Lockbourne Rd Unit R
- 1097 Rendezvous Ln
- 1101 Meadow Ln
- 1091 Vernon Dr
- 4207 Crosspointe Dr
- 965 Radbourne Dr
- 1341 Halfhill Way
- 989 Lavender Ln
- 864 Robmeyer Dr
- 904 Kyle Ave
- 1068 Tobi Dr
- 4410 Holstein Dr
- 1566 Chillicothe St
- 812 Breathitt Ave
- 3940 Hillman Rd W
- 1118 Maplewood Rd
- 1632 Marlboro Ave
- 3785 S Ohio Ave
- 1649 Obetz Ave
- 1199 Rendezvous Ln
- 1209 Rendezvous Ln
- 1193 Rendezvous Ln
- 1215 Rendezvous Ln
- 1180 Rendezvous Ln
- 1192 Rendezvous Ln
- 1206 Rendezvous Ln
- 1168 Rendezvous Ln
- 1181 Rendezvous Ln
- 4187 Sestos Dr
- 4171 Sestos Dr
- 4195 Sestos Dr
- 1188 Viewpointe Dr
- 1175 Rendezvous Ln
- 1182 Viewpointe Dr
- 4163 Sestos Dr
- 4203 Sestos Dr
- 1159 Viewpointe Dr
- 1176 Viewpointe Dr
- 1169 Rendezvous Ln