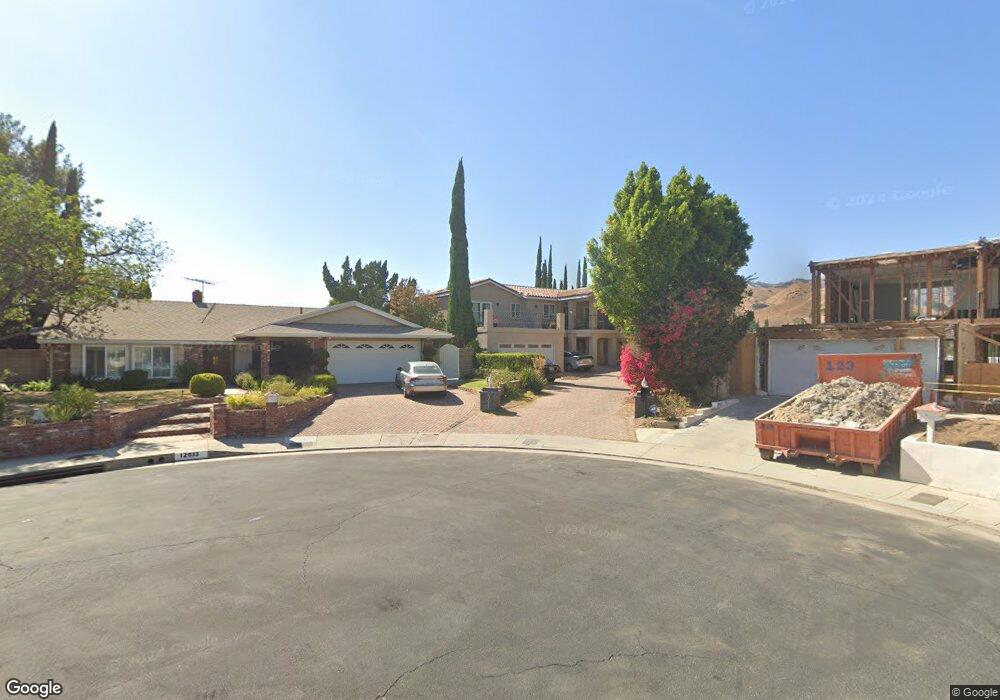
12037 Darby Ave Porter Ranch, CA 91326
Porter Ranch NeighborhoodEstimated Value: $1,467,000 - $1,855,000
5
Beds
4
Baths
4,052
Sq Ft
$401/Sq Ft
Est. Value
About This Home
This home is located at 12037 Darby Ave, Porter Ranch, CA 91326 and is currently estimated at $1,624,581, approximately $400 per square foot. 12037 Darby Ave is a home located in Los Angeles County with nearby schools including Robert Frost Middle School, Northridge Academy High, and Valley Academy of Arts & Sciences.
Ownership History
Date
Name
Owned For
Owner Type
Purchase Details
Closed on
Aug 21, 2018
Sold by
Raffel Charmane C and The Darby Trust
Bought by
Raffel Charmaine C
Current Estimated Value
Purchase Details
Closed on
Mar 12, 2010
Sold by
Raffel Charmaine C
Bought by
Huggins Lawrence and Raffel Charmaine C
Purchase Details
Closed on
Oct 9, 1997
Sold by
Chung Kwang J and Chung Nami
Bought by
Raffel Travice and Raffel Charmaine C
Home Financials for this Owner
Home Financials are based on the most recent Mortgage that was taken out on this home.
Original Mortgage
$218,700
Interest Rate
9.62%
Purchase Details
Closed on
May 3, 1993
Sold by
Moon Jin Sung and Moon Heo Myeong
Bought by
Chung Kwang Jo and Chung Nami
Home Financials for this Owner
Home Financials are based on the most recent Mortgage that was taken out on this home.
Original Mortgage
$150,000
Interest Rate
7.34%
Create a Home Valuation Report for This Property
The Home Valuation Report is an in-depth analysis detailing your home's value as well as a comparison with similar homes in the area
Home Values in the Area
Average Home Value in this Area
Purchase History
| Date | Buyer | Sale Price | Title Company |
|---|---|---|---|
| Raffel Charmaine C | -- | None Available | |
| Huggins Lawrence | $1,000 | None Available | |
| Raffel Travice | $243,000 | North American Title Co | |
| Chung Kwang Jo | $250,000 | -- |
Source: Public Records
Mortgage History
| Date | Status | Borrower | Loan Amount |
|---|---|---|---|
| Previous Owner | Raffel Travice | $218,700 | |
| Previous Owner | Chung Kwang Jo | $150,000 |
Source: Public Records
Tax History Compared to Growth
Tax History
| Year | Tax Paid | Tax Assessment Tax Assessment Total Assessment is a certain percentage of the fair market value that is determined by local assessors to be the total taxable value of land and additions on the property. | Land | Improvement |
|---|---|---|---|---|
| 2025 | $8,171 | $635,979 | $317,392 | $318,587 |
| 2024 | $8,171 | $623,510 | $311,169 | $312,341 |
| 2023 | $8,023 | $611,285 | $305,068 | $306,217 |
| 2022 | $7,667 | $599,300 | $299,087 | $300,213 |
| 2021 | $7,557 | $587,550 | $293,223 | $294,327 |
| 2019 | $7,341 | $570,126 | $284,527 | $285,599 |
| 2018 | $7,443 | $582,350 | $246,326 | $336,024 |
| 2017 | $7,286 | $570,933 | $241,497 | $329,436 |
| 2016 | $6,774 | $533,710 | $236,762 | $296,948 |
| 2015 | $6,680 | $525,694 | $233,206 | $292,488 |
| 2014 | $6,174 | $476,298 | $228,638 | $247,660 |
Source: Public Records
Map
Nearby Homes
- 11958 Darby Ave
- 18657 Kirkcolm Ln
- 12073 Beaufait Ave
- 18810 Kirkcolm Ln
- 11959 Dunnicliffe Ct
- 12356 Longacre Ave
- 11813 Killimore Ave
- 19015 Braemore Rd
- 18912 Kinbrace St
- 12530 Longacre Ave
- 11830 Killimore Ave
- 18501 Calle Vista Cir
- 18169 N Knoll Hill
- 19317 Vista Grande Way
- 18200 Sheffield Ln
- 11717 Pala Mesa Dr
- 11800 Zelzah Ave
- 11673 Porter Valley Dr
- 17900 Bull Canyon Rd
- 11410 Reseda Blvd
- 12033 Darby Ave
- 18726 Kirkcolm Ln
- 12040 Darby Ave
- 18740 Kirkcolm Ln
- 18718 Kirkcolm Ln
- 12025 Darby Ave
- 18710 Kirkcolm Ln
- 12036 Darby Ave
- 12026 Stewarton Dr
- 12030 Stewarton Dr
- 12019 Darby Ave
- 12040 Stewarton Dr
- 12018 Stewarton Dr
- 18700 Kirkcolm Ln
- 12028 Darby Ave
- 12101 Darby Ave
- 12050 Stewarton Dr
- 12010 Stewarton Dr
- 12032 Darby Ave
- 18715 Kirkcolm Ln