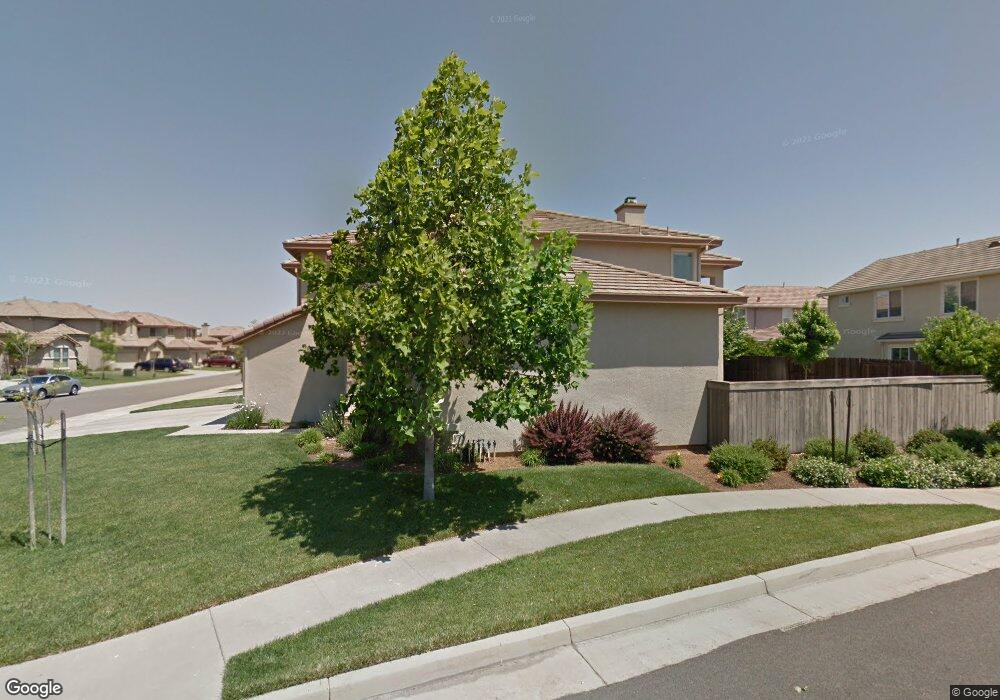
12045 Mandolin Way Rancho Cordova, CA 95742
Anatolia NeighborhoodEstimated Value: $582,000 - $686,000
5
Beds
3
Baths
2,821
Sq Ft
$230/Sq Ft
Est. Value
About This Home
This home is located at 12045 Mandolin Way, Rancho Cordova, CA 95742 and is currently estimated at $649,661, approximately $230 per square foot. 12045 Mandolin Way is a home located in Sacramento County with nearby schools including Robert J. McGarvey Elementary, Katherine L. Albiani Middle School, and Pleasant Grove High School.
Ownership History
Date
Name
Owned For
Owner Type
Purchase Details
Closed on
Apr 10, 2008
Sold by
Us Bank Na
Bought by
Joyce Michael and Joyce Robert
Current Estimated Value
Home Financials for this Owner
Home Financials are based on the most recent Mortgage that was taken out on this home.
Original Mortgage
$285,600
Outstanding Balance
$180,065
Interest Rate
5.88%
Mortgage Type
Purchase Money Mortgage
Estimated Equity
$469,596
Purchase Details
Closed on
Sep 13, 2007
Sold by
Hamblin Keith J and Hamblin Mary J
Bought by
U S Bank Na and Terwin Mortgage Trust 2006-7
Purchase Details
Closed on
Oct 16, 2006
Sold by
Hamblin Keith J and Hamblin Mary J
Bought by
Hamblin Keith J and Hamblin Mary J
Purchase Details
Closed on
Feb 14, 2006
Sold by
Jts Communities
Bought by
Hamblin Keith J and Hamblin Mary J
Home Financials for this Owner
Home Financials are based on the most recent Mortgage that was taken out on this home.
Original Mortgage
$550,881
Interest Rate
6.2%
Mortgage Type
Purchase Money Mortgage
Create a Home Valuation Report for This Property
The Home Valuation Report is an in-depth analysis detailing your home's value as well as a comparison with similar homes in the area
Home Values in the Area
Average Home Value in this Area
Purchase History
| Date | Buyer | Sale Price | Title Company |
|---|---|---|---|
| Joyce Michael | $357,000 | Fidelity National Title Co | |
| U S Bank Na | $427,999 | Alliance Title Company | |
| Hamblin Keith J | -- | None Available | |
| Hamblin Keith J | $689,000 | Placer Title Company |
Source: Public Records
Mortgage History
| Date | Status | Borrower | Loan Amount |
|---|---|---|---|
| Open | Joyce Michael | $285,600 | |
| Previous Owner | Hamblin Keith J | $550,881 |
Source: Public Records
Tax History Compared to Growth
Tax History
| Year | Tax Paid | Tax Assessment Tax Assessment Total Assessment is a certain percentage of the fair market value that is determined by local assessors to be the total taxable value of land and additions on the property. | Land | Improvement |
|---|---|---|---|---|
| 2025 | $7,658 | $468,913 | $197,022 | $271,891 |
| 2024 | $7,658 | $459,719 | $193,159 | $266,560 |
| 2023 | $7,466 | $450,706 | $189,372 | $261,334 |
| 2022 | $7,307 | $441,869 | $185,659 | $256,210 |
| 2021 | $7,256 | $433,206 | $182,019 | $251,187 |
| 2020 | $7,148 | $428,765 | $180,153 | $248,612 |
| 2019 | $7,014 | $420,359 | $176,621 | $243,738 |
| 2018 | $6,827 | $412,117 | $173,158 | $238,959 |
| 2017 | $6,696 | $404,037 | $169,763 | $234,274 |
| 2016 | $6,551 | $396,116 | $166,435 | $229,681 |
| 2015 | $6,421 | $390,166 | $163,935 | $226,231 |
| 2014 | $6,142 | $366,610 | $154,036 | $212,574 |
Source: Public Records
Map
Nearby Homes
- 4308 Hartland Way
- 4389 Kilroy Ct
- 12042 Mircado Way
- 4253 Privas Way
- 4163 Aura Way
- 12142 Alamosa Dr
- Plan 3 at Montelena - Starblossom
- Plan 2 at Montelena - Starblossom
- Plan 1 at Montelena - Starblossom
- Plan 4 at Montelena - Starblossom
- 12086 Mircado Way
- Tucson Plan at Canyon at The Ranch
- San Blas Plan at Paseo at The Ranch
- Fayetteville Plan at Canyon at The Ranch
- Pasadena ESP Plan at Canyon at The Ranch
- Macon Plan at Canyon at The Ranch
- Pasadena Plan at Canyon at The Ranch
- Aruba Plan at Paseo at The Ranch
- Santa Rosa II Plan at Canyon at The Ranch
- Cayman Plan at Paseo at The Ranch
- 12041 Mandolin Way
- 11991 Erato Cir
- 11995 Erato Cir
- 12037 Mandolin Way
- 4354 Maeve Ct
- 12044 Mandolin Way
- 12040 Mandolin Way
- 11999 Erato Cir
- 12036 Mandolin Way
- 12033 Mandolin Way
- 4355 Maeve Ct
- 12003 Erato Cir
- 12032 Mandolin Way
- 12005 Pericles Dr
- 4358 Maeve Ct
- 12029 Mandolin Way
- 11990 Erato Cir
- 4361 Rosenstock Way
- 12007 Erato Cir
- 11994 Erato Cir