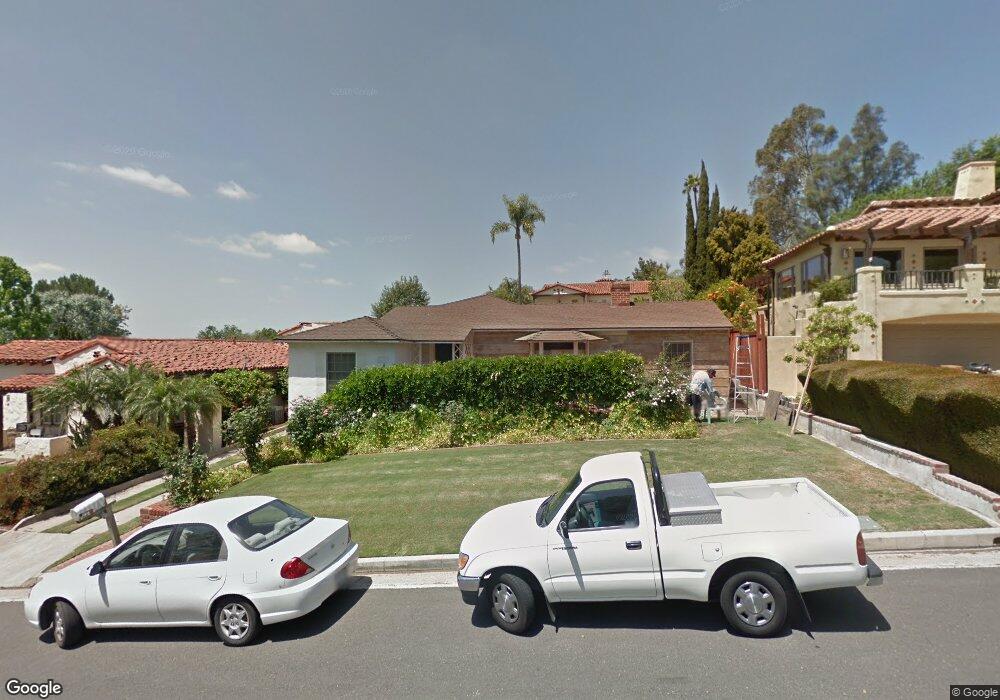
1205 Luanne Ave Fullerton, CA 92831
Raymond Hills NeighborhoodEstimated Value: $1,128,626 - $1,341,000
3
Beds
2
Baths
1,746
Sq Ft
$728/Sq Ft
Est. Value
About This Home
This home is located at 1205 Luanne Ave, Fullerton, CA 92831 and is currently estimated at $1,270,907, approximately $727 per square foot. 1205 Luanne Ave is a home located in Orange County with nearby schools including Raymond Elementary School, Ladera Vista Junior High School, and Fullerton Union High School.
Ownership History
Date
Name
Owned For
Owner Type
Purchase Details
Closed on
Apr 6, 1999
Sold by
Christine Romer
Bought by
Arthur Kevin A and Regoli Arthur Karen J
Current Estimated Value
Home Financials for this Owner
Home Financials are based on the most recent Mortgage that was taken out on this home.
Original Mortgage
$240,000
Outstanding Balance
$60,166
Interest Rate
6.92%
Estimated Equity
$1,210,741
Purchase Details
Closed on
May 20, 1998
Sold by
Christine Romer
Bought by
Romer Christine D and The Christine D Romer Trust
Purchase Details
Closed on
Oct 13, 1993
Sold by
Ouweleen Frederic and Ouweleen Jane H
Bought by
Romer Christine
Home Financials for this Owner
Home Financials are based on the most recent Mortgage that was taken out on this home.
Original Mortgage
$203,150
Interest Rate
6.88%
Create a Home Valuation Report for This Property
The Home Valuation Report is an in-depth analysis detailing your home's value as well as a comparison with similar homes in the area
Home Values in the Area
Average Home Value in this Area
Purchase History
| Date | Buyer | Sale Price | Title Company |
|---|---|---|---|
| Arthur Kevin A | $350,000 | Chicago Title Co | |
| Romer Christine D | -- | -- | |
| Romer Christine | $260,000 | -- |
Source: Public Records
Mortgage History
| Date | Status | Borrower | Loan Amount |
|---|---|---|---|
| Open | Arthur Kevin A | $240,000 | |
| Previous Owner | Romer Christine | $203,150 | |
| Closed | Arthur Kevin A | $92,600 |
Source: Public Records
Tax History
| Year | Tax Paid | Tax Assessment Tax Assessment Total Assessment is a certain percentage of the fair market value that is determined by local assessors to be the total taxable value of land and additions on the property. | Land | Improvement |
|---|---|---|---|---|
| 2025 | $6,055 | $548,690 | $473,331 | $75,359 |
| 2024 | $6,055 | $537,932 | $464,050 | $73,882 |
| 2023 | $5,908 | $527,385 | $454,951 | $72,434 |
| 2022 | $5,867 | $517,045 | $446,031 | $71,014 |
| 2021 | $5,764 | $506,907 | $437,285 | $69,622 |
| 2020 | $5,732 | $501,710 | $432,801 | $68,909 |
| 2019 | $5,582 | $491,873 | $424,315 | $67,558 |
| 2018 | $5,497 | $482,229 | $415,995 | $66,234 |
| 2017 | $5,405 | $472,774 | $407,838 | $64,936 |
| 2016 | $5,291 | $463,504 | $399,841 | $63,663 |
| 2015 | $5,144 | $456,542 | $393,835 | $62,707 |
| 2014 | $4,994 | $447,599 | $386,120 | $61,479 |
Source: Public Records
Map
Nearby Homes
- 1219 Frances Ave
- 1354 Shadow Ln Unit 102
- 1354 Shadow Ln Unit (D) 202
- 1354 Shadow Ln
- 1360 Shadow Ln Unit G
- 149 E Union Ave
- 518 Blue Water Ln
- 804 E Glenwood Ave
- 1501 N Brea Blvd Unit 212
- 706 Nancy Ln
- 142 Marion Blvd
- 0 Elsa Dr
- 1001 Nutwood Ave
- 513 N Yale Ave
- 1941 Valwood Dr
- 1941 Skyline Dr
- 301 W Malvern Ave
- 151 N Lincoln Ave
- 1320 N Raymond Ave
- 208 N Cornell Ave
- 1211 Luanne Ave
- 1203 Luanne Ave
- 401 Cannon Ln
- 1215 Luanne Ave
- 1200 Luanne Ave
- 1208 Luanne Ave
- 1221 Luanne Ave
- 1212 Luanne Ave
- 1210 Frances Ave
- 408 Cannon Ln
- 412 Cannon Ln
- 1201 Sheppard Dr
- 1223 Luanne Ave
- 400 Cannon Ln
- 406 Cannon Ln
- 504 Cannon Ln
- 1214 Frances Ave
- 1224 Luanne Ave
- 1207 Sheppard Dr
- 1209 Frances Ave
Your Personal Tour Guide
Ask me questions while you tour the home.