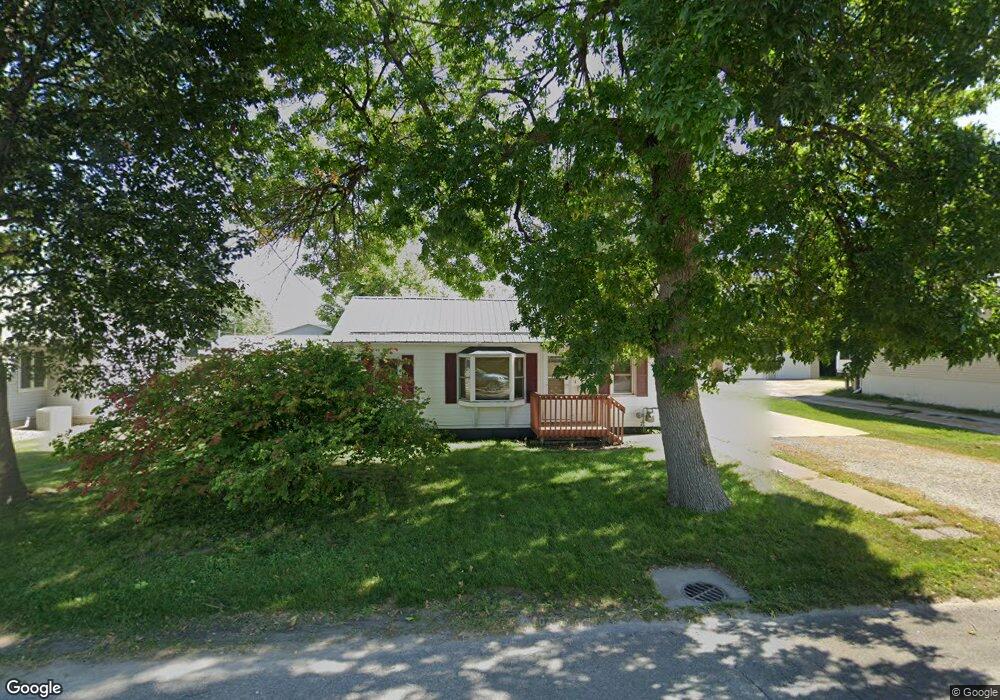
1206 4th Ave Vinton, IA 52349
Estimated Value: $105,000 - $127,000
2
Beds
1
Bath
680
Sq Ft
$169/Sq Ft
Est. Value
About This Home
This home is located at 1206 4th Ave, Vinton, IA 52349 and is currently estimated at $114,629, approximately $168 per square foot. 1206 4th Ave is a home located in Benton County with nearby schools including Tilford Elementary School, Shellsburg Elementary School, and Vinton-Shellsburg Middle School.
Ownership History
Date
Name
Owned For
Owner Type
Purchase Details
Closed on
Jun 28, 2021
Sold by
Bistline Pamela A and Bistline Roger
Bought by
Enos Nathan M
Current Estimated Value
Home Financials for this Owner
Home Financials are based on the most recent Mortgage that was taken out on this home.
Original Mortgage
$63,353
Outstanding Balance
$18,957
Interest Rate
2.9%
Mortgage Type
New Conventional
Estimated Equity
$95,672
Purchase Details
Closed on
Oct 10, 2005
Sold by
Langmann Greta F
Bought by
Langmann Pamela A
Create a Home Valuation Report for This Property
The Home Valuation Report is an in-depth analysis detailing your home's value as well as a comparison with similar homes in the area
Home Values in the Area
Average Home Value in this Area
Purchase History
| Date | Buyer | Sale Price | Title Company |
|---|---|---|---|
| Enos Nathan M | $85,000 | None Available | |
| Langmann Pamela A | -- | None Available |
Source: Public Records
Mortgage History
| Date | Status | Borrower | Loan Amount |
|---|---|---|---|
| Open | Enos Nathan M | $63,353 |
Source: Public Records
Tax History Compared to Growth
Tax History
| Year | Tax Paid | Tax Assessment Tax Assessment Total Assessment is a certain percentage of the fair market value that is determined by local assessors to be the total taxable value of land and additions on the property. | Land | Improvement |
|---|---|---|---|---|
| 2025 | $1,736 | $110,000 | $16,500 | $93,500 |
| 2024 | $1,736 | $102,900 | $16,500 | $86,400 |
| 2023 | $1,668 | $102,900 | $16,500 | $86,400 |
| 2022 | $1,710 | $86,400 | $13,200 | $73,200 |
| 2021 | $1,710 | $86,400 | $13,200 | $73,200 |
| 2020 | $1,028 | $56,300 | $12,500 | $43,800 |
| 2019 | $1,080 | $56,300 | $12,500 | $43,800 |
| 2018 | $1,046 | $57,800 | $12,000 | $45,800 |
| 2017 | $1,046 | $57,800 | $12,000 | $45,800 |
| 2016 | $978 | $54,000 | $11,200 | $42,800 |
| 2015 | $978 | $54,000 | $11,200 | $42,800 |
| 2014 | $602 | $36,500 | $0 | $0 |
Source: Public Records
Map
Nearby Homes