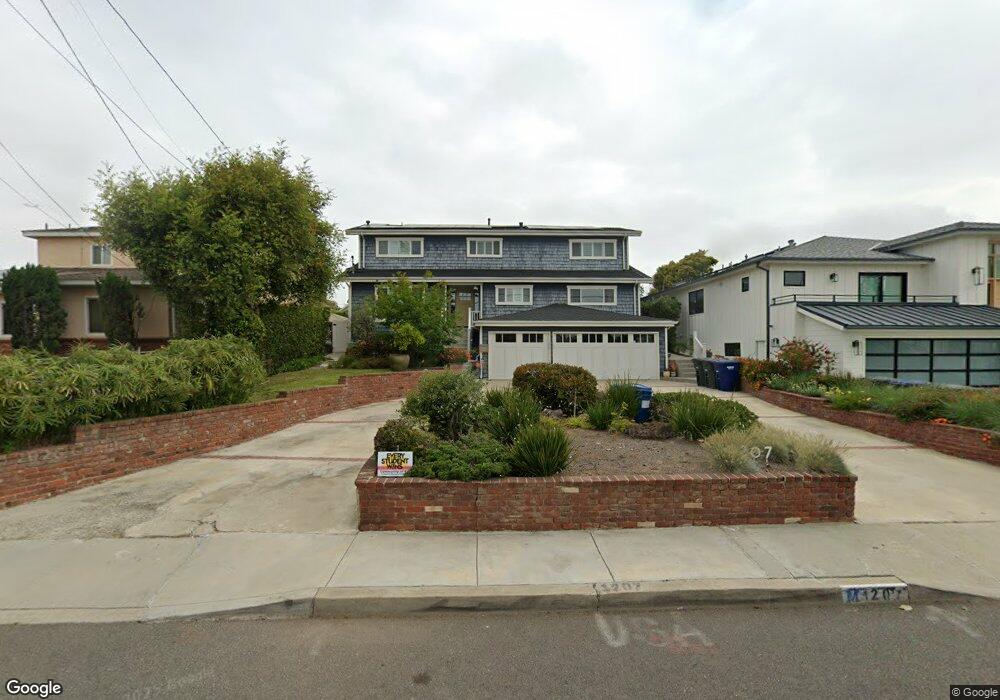
1207 E Maple Ave El Segundo, CA 90245
Estimated Value: $2,506,416 - $3,036,000
6
Beds
3
Baths
3,192
Sq Ft
$878/Sq Ft
Est. Value
About This Home
This home is located at 1207 E Maple Ave, El Segundo, CA 90245 and is currently estimated at $2,803,354, approximately $878 per square foot. 1207 E Maple Ave is a home located in Los Angeles County with nearby schools including Center Street Elementary, El Segundo Middle School, and El Segundo High School.
Ownership History
Date
Name
Owned For
Owner Type
Purchase Details
Closed on
Jan 12, 2010
Sold by
Barnwell M J and Barnwell Family Trust
Bought by
Haas Mary H
Current Estimated Value
Home Financials for this Owner
Home Financials are based on the most recent Mortgage that was taken out on this home.
Original Mortgage
$855,000
Outstanding Balance
$563,632
Interest Rate
5.03%
Mortgage Type
New Conventional
Estimated Equity
$2,239,722
Purchase Details
Closed on
Oct 31, 2008
Sold by
Barnwell M J and The Barnwell Family Trust
Bought by
Barnwell M J and The Barnwell Family Trust
Purchase Details
Closed on
Jul 10, 1995
Sold by
Barnwell Marion J and Barnwell Nancy B
Bought by
Barnwell M J and M J Barnwell Revocable Trust
Purchase Details
Closed on
Jul 5, 1994
Sold by
Barnwell Marion P and Barnwell Joan R
Bought by
Barnwell Marion P
Create a Home Valuation Report for This Property
The Home Valuation Report is an in-depth analysis detailing your home's value as well as a comparison with similar homes in the area
Home Values in the Area
Average Home Value in this Area
Purchase History
| Date | Buyer | Sale Price | Title Company |
|---|---|---|---|
| Haas Mary H | $1,140,000 | Lawyers Title | |
| Barnwell M J | -- | None Available | |
| Barnwell M J | -- | Continental Land Title | |
| Barnwell Marion P | -- | -- |
Source: Public Records
Mortgage History
| Date | Status | Borrower | Loan Amount |
|---|---|---|---|
| Open | Haas Mary H | $855,000 |
Source: Public Records
Tax History
| Year | Tax Paid | Tax Assessment Tax Assessment Total Assessment is a certain percentage of the fair market value that is determined by local assessors to be the total taxable value of land and additions on the property. | Land | Improvement |
|---|---|---|---|---|
| 2025 | $16,309 | $1,471,524 | $1,127,399 | $344,125 |
| 2024 | $16,309 | $1,442,672 | $1,105,294 | $337,378 |
| 2023 | $15,879 | $1,414,385 | $1,083,622 | $330,763 |
| 2022 | $16,051 | $1,386,653 | $1,062,375 | $324,278 |
| 2021 | $15,815 | $1,359,465 | $1,041,545 | $317,920 |
| 2019 | $15,275 | $1,319,145 | $1,010,653 | $308,492 |
| 2018 | $14,303 | $1,293,281 | $990,837 | $302,444 |
| 2016 | $13,880 | $1,243,062 | $952,362 | $290,700 |
| 2015 | $13,706 | $1,224,391 | $938,057 | $286,334 |
| 2014 | $13,404 | $1,200,408 | $919,682 | $280,726 |
Source: Public Records
Map
Nearby Homes
- 825 Center St
- 860 Bungalow Dr
- 1116 E Imperial Ave
- 1112 E Imperial Ave
- 1510 E Maple Ave
- 1514 E Maple Ave
- 500 E Imperial Ave
- 906 E Imperial Ave
- 529 E Walnut Ave
- 519 E Sycamore Ave
- 572 E Imperial Ave
- 432 Lomita St
- 529 Sierra Place
- 426 E Imperial Ave
- 329 E Maple Ave
- 1225 E Grand Ave Unit B
- 212 E Imperial Ave Unit A
- 212 E Imperial Ave Unit E
- 121 E Walnut Ave
- 211 E Pine Ave
- 1209 E Maple Ave
- 1205 E Maple Ave
- 1213 E Maple Ave
- 1201 E Maple Ave
- 1206 E Sycamore Ave
- 1202 E Sycamore Ave
- 1208 E Sycamore Ave
- 1219 E Maple Ave
- 1208 E Maple Ave
- 1200 E Sycamore Ave
- 1210 E Sycamore Ave
- 808 Center St
- 1204 E Maple Ave
- 812 Center St
- 1212 E Maple Ave
- 802 Center St
- 818 Center St
- 1200 E Maple Ave
- 1225 E Maple Ave
- 1214 E Sycamore Ave
Your Personal Tour Guide
Ask me questions while you tour the home.