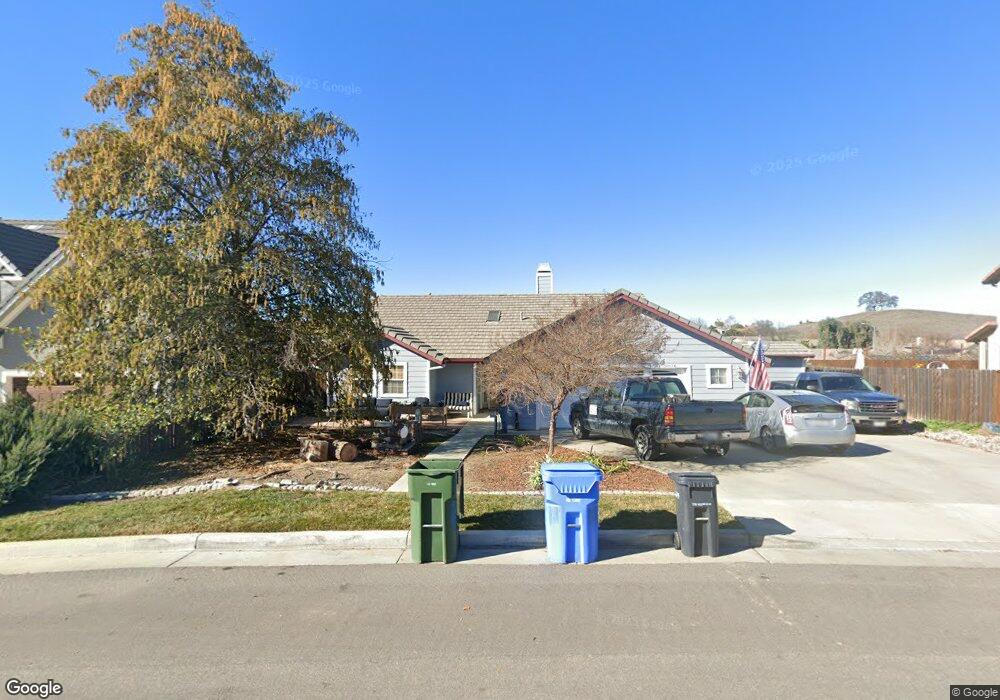
1209 Blue Oak Way Unit L108 Paso Robles, CA 93446
Estimated Value: $661,000 - $793,000
3
Beds
2
Baths
1,494
Sq Ft
$476/Sq Ft
Est. Value
About This Home
This home is located at 1209 Blue Oak Way Unit L108, Paso Robles, CA 93446 and is currently estimated at $711,688, approximately $476 per square foot. 1209 Blue Oak Way Unit L108 is a home located in San Luis Obispo County with nearby schools including Winifred Pifer Elementary School, Daniel Lewis Middle School, and Paso Robles High School.
Ownership History
Date
Name
Owned For
Owner Type
Purchase Details
Closed on
Apr 22, 2025
Sold by
Wimberley D Randy D and Wimberley David Randall
Bought by
David Randall Wimberley 2025 Revocable Trust and Wimberley
Current Estimated Value
Purchase Details
Closed on
May 3, 2002
Sold by
Yates Paula Diane
Bought by
Yates Richard
Home Financials for this Owner
Home Financials are based on the most recent Mortgage that was taken out on this home.
Original Mortgage
$100,000
Interest Rate
7.13%
Purchase Details
Closed on
Apr 15, 2002
Sold by
Shadow Canyon Estates Llc
Bought by
Wimberley D Randy and Wimberley Gail J
Home Financials for this Owner
Home Financials are based on the most recent Mortgage that was taken out on this home.
Original Mortgage
$100,000
Interest Rate
7.13%
Create a Home Valuation Report for This Property
The Home Valuation Report is an in-depth analysis detailing your home's value as well as a comparison with similar homes in the area
Home Values in the Area
Average Home Value in this Area
Purchase History
| Date | Buyer | Sale Price | Title Company |
|---|---|---|---|
| David Randall Wimberley 2025 Revocable Trust | -- | None Listed On Document | |
| Yates Richard | -- | Fidelity Title Company | |
| Wimberley D Randy | $85,500 | Fidelity Title Company |
Source: Public Records
Mortgage History
| Date | Status | Borrower | Loan Amount |
|---|---|---|---|
| Previous Owner | Wimberley D Randy | $100,000 |
Source: Public Records
Tax History Compared to Growth
Tax History
| Year | Tax Paid | Tax Assessment Tax Assessment Total Assessment is a certain percentage of the fair market value that is determined by local assessors to be the total taxable value of land and additions on the property. | Land | Improvement |
|---|---|---|---|---|
| 2025 | $5,264 | $411,608 | $140,781 | $270,827 |
| 2024 | $5,158 | $403,538 | $138,021 | $265,517 |
| 2023 | $5,158 | $395,626 | $135,315 | $260,311 |
| 2022 | $5,004 | $387,869 | $132,662 | $255,207 |
| 2021 | $4,930 | $380,264 | $130,061 | $250,203 |
| 2020 | $4,838 | $376,366 | $128,728 | $247,638 |
| 2019 | $4,760 | $368,987 | $126,204 | $242,783 |
| 2018 | $4,703 | $361,753 | $123,730 | $238,023 |
| 2017 | $4,436 | $354,660 | $121,304 | $233,356 |
| 2016 | $4,340 | $347,707 | $118,926 | $228,781 |
| 2015 | $4,311 | $342,485 | $117,140 | $225,345 |
| 2014 | $4,161 | $335,777 | $114,846 | $220,931 |
Source: Public Records
Map
Nearby Homes
- 315 Oak Meadow Ln
- 301 Oak Meadow Ln
- 1150 Grassy Hollow Way
- 331 Wild Mustard Ln
- 210 Partridge Ave
- 225 Lark Dr
- 1320 Teal Ave
- 230 Partridge Ave
- 1312 Oak Ridge Way
- 326 Partridge Ave
- 378 Lark Dr
- 912 Salida Del Sol Dr
- 1136 Mazzini Rd
- 1128 Golf Place
- Liberty II Plan at Nevina - Freedom 50
- Pinnacle Plan at Nevina - Freedom 60
- Reunion II Plan at Nevina - Freedom 40
- Excite II Plan at Nevina - Freedom 50
- Meridian Plan at Nevina - Freedom 60
- Proclaim II Plan at Nevina - Freedom 50
- 1211 Blue Oak Way Unit L109
- 1211 Blue Oak Way
- 1210 Grassy Hollow Way
- 1207 Blue Oak Way Unit L107
- 1207 Blue Oak Way
- 1212 Grassy Hollow Way
- 1208 Grassy Hollow Way
- 1214 Grassy Hollow Way
- 0 Grand Canyon Dr
- 1205 Blue Oak Way Unit L106
- 1205 Blue Oak Way
- 1206 Grassy Hollow Way
- 1208 Blue Oak Way Unit L110
- 1208 Blue Oak Way
- 1211 Grassy Hollow Way
- 1204 Grassy Hollow Way
- 1203 Blue Oak Way Unit L105
- 1203 Blue Oak Way
- 1213 Grassy Hollow Way