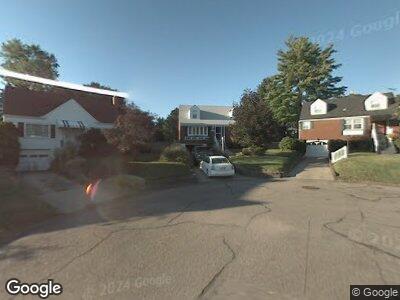
121 Bygate Cir Pittsburgh, PA 15220
Scott Township NeighborhoodEstimated Value: $261,000 - $274,000
2
Beds
2
Baths
1,200
Sq Ft
$223/Sq Ft
Est. Value
About This Home
This home is located at 121 Bygate Cir, Pittsburgh, PA 15220 and is currently estimated at $268,136, approximately $223 per square foot. 121 Bygate Cir is a home located in Allegheny County with nearby schools including Chartiers Valley Intermediate School, Chartiers Valley Primary School, and Chartiers Valley Middle School.
Ownership History
Date
Name
Owned For
Owner Type
Purchase Details
Closed on
Feb 15, 2013
Sold by
Cullen Dillahay Judith A and Loeffert Eileen J
Bought by
Hayes Timothy G
Current Estimated Value
Home Financials for this Owner
Home Financials are based on the most recent Mortgage that was taken out on this home.
Original Mortgage
$123,717
Outstanding Balance
$88,650
Interest Rate
3.12%
Mortgage Type
FHA
Estimated Equity
$180,846
Purchase Details
Closed on
Dec 6, 2007
Sold by
Amenta Jason A
Bought by
Cullen Dillahay Judith A
Home Financials for this Owner
Home Financials are based on the most recent Mortgage that was taken out on this home.
Original Mortgage
$119,200
Interest Rate
6.3%
Mortgage Type
New Conventional
Purchase Details
Closed on
Sep 19, 2002
Sold by
Somogyi George T and Kiss Susan
Bought by
Amenta Jason A and Cancelliere Deanna M
Purchase Details
Closed on
Nov 19, 1997
Sold by
Waller Raymond and Waller Barbara
Bought by
Somogyi George T and Kiss Susan
Create a Home Valuation Report for This Property
The Home Valuation Report is an in-depth analysis detailing your home's value as well as a comparison with similar homes in the area
Home Values in the Area
Average Home Value in this Area
Purchase History
| Date | Buyer | Sale Price | Title Company |
|---|---|---|---|
| Hayes Timothy G | $126,000 | -- | |
| Cullen Dillahay Judith A | $149,900 | -- | |
| Amenta Jason A | $120,000 | -- | |
| Somogyi George T | $110,000 | -- |
Source: Public Records
Mortgage History
| Date | Status | Borrower | Loan Amount |
|---|---|---|---|
| Open | Hayes Timothy G | $123,717 | |
| Previous Owner | Cullen Dillahay Judith A | $119,200 |
Source: Public Records
Tax History Compared to Growth
Tax History
| Year | Tax Paid | Tax Assessment Tax Assessment Total Assessment is a certain percentage of the fair market value that is determined by local assessors to be the total taxable value of land and additions on the property. | Land | Improvement |
|---|---|---|---|---|
| 2024 | $4,599 | $139,800 | $45,300 | $94,500 |
| 2023 | $4,096 | $139,800 | $45,300 | $94,500 |
| 2022 | $4,007 | $139,800 | $45,300 | $94,500 |
| 2021 | $661 | $139,800 | $45,300 | $94,500 |
| 2020 | $3,839 | $139,800 | $45,300 | $94,500 |
| 2019 | $4,256 | $139,800 | $45,300 | $94,500 |
| 2018 | $746 | $157,800 | $45,300 | $112,500 |
| 2017 | $4,208 | $157,800 | $45,300 | $112,500 |
| 2016 | $746 | $157,800 | $45,300 | $112,500 |
| 2015 | $746 | $157,800 | $45,300 | $112,500 |
| 2014 | $3,989 | $157,800 | $45,300 | $112,500 |
Source: Public Records
Map
Nearby Homes
- 2114 Swallow Hill Rd
- 12 Fieldstone Dr
- 409 Foxwood Ln
- 2225 Swallow Hill Rd
- 130 Foxcroft Rd
- 2034 Swallow Hill Rd Unit 403
- 2034 Swallow Hill Rd Unit 329
- 2034 Swallow Hill Rd Unit 130
- 2034 Swallow Hill Rd Unit 420
- 2034 Swallow Hill Rd Unit 430
- 2034 Swallow Hill Rd Unit 112
- 2034 Swallow Hill Rd Unit 116
- 2160 Greentree Rd Unit 305W
- 2160 Greentree Rd Unit 100W
- 2160 Greentree Rd Unit 102W
- 2160 Greentree Rd Unit 708W
- 2120 Greentree Rd Unit 705E
- 2120 Greentree Rd Unit 209E
- 10 Claireview Dr
- 120 Lee St
- 121 Bygate Cir
- 122 Bygate Cir
- 119 Bygate Cir
- 618 Robin Dr
- 624 Robin Dr
- 120 Bygate Cir
- 620 Robin Dr
- 614 Robin Dr
- 628 Robin Dr
- 116 Bygate Cir
- 111 Bygate Cir
- 610 Robin Dr
- 2110 Swallow Hill Rd
- 114 Bygate Cir
- 2118 Swallow Hill Rd
- 2106 Swallow Hill Rd
- 2122 Swallow Hill Rd
- 629 Hope St
- 112 Bygate Cir
- 606 Robin Dr