
Seller's Agent in 2025
Courtney Roberts
Roberts & Co. Real Estate Svcs
(850) 251-6975
61 Total Sales
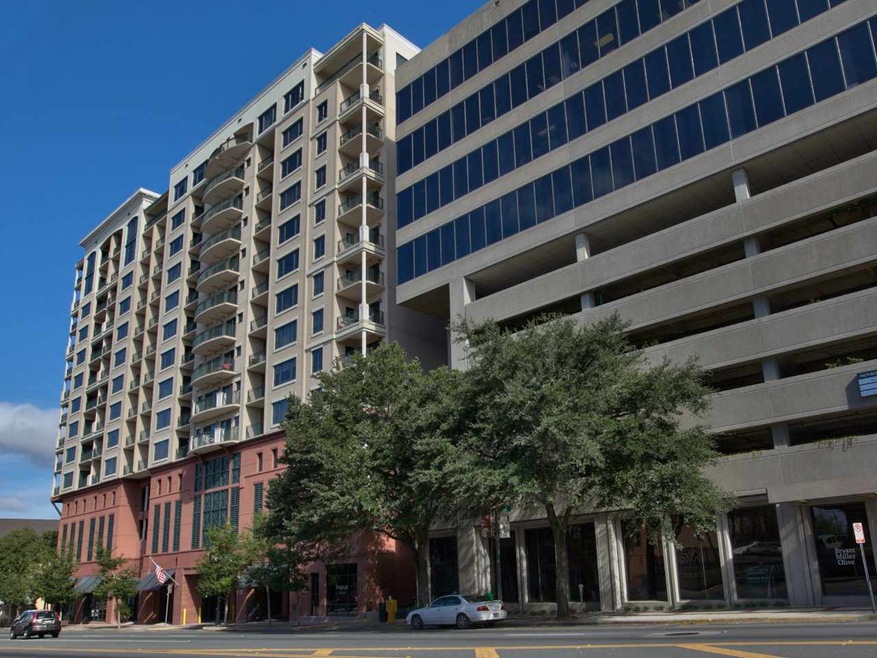
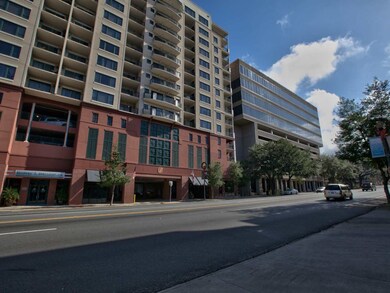
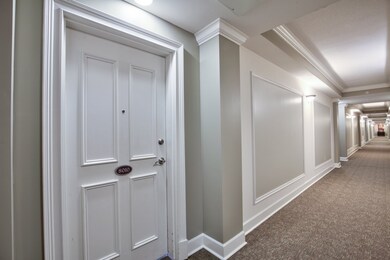
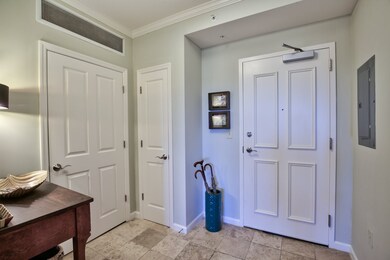
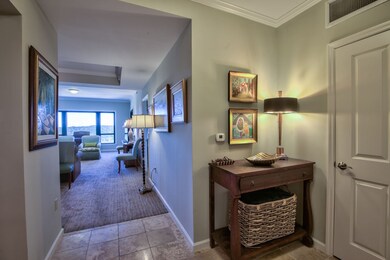
Downtown luxury condo - Out of state, one owner has priced this 2 bedroom 2.5 bath the lowest price per sq ft in the Tennyson. Newer carpet, window coverings, has had very little use. Spectacular view from 2 balconies, facing Northeast and East. Property includes one parking space, #233 and storage room #210E, plus washer and dryer. Vacant and easy to show! Two parking spaces inside garage to show or on the metered parking out front. Condo features board room, gym, sauna, concierge, a favorite of Capitol, FSU and owners wishing for 18 hour downtown activities. corner unit facing east with spectacular view of the ever changing leaves on the trees. 2 balconies, 1 parking space, storage unit #210E. Amenities offered are: board room, gym, sauna, concierge, private parking, washer & dryer.
Last Agent to Sell the Property
Re/Max Professionals Realty License #3003041 Listed on: 03/15/2018
Home Type
Est. Annual Taxes
Year Built
HOA Fees
Parking
Home Design
Interior Spaces
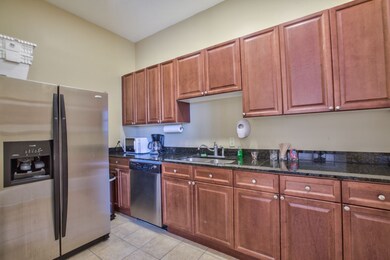
Kitchen
Flooring
Bedrooms and Bathrooms
Laundry
Schools
Utilities
Community Details
Listing and Financial Details
| Date | Type | Sale Price | Title Company |
|---|---|---|---|
| Interfamily Deed Transfer | -- | None Available | |
| Warranty Deed | $1,000,000 | None Available |
| Date | Event | Price | Change | Sq Ft Price |
|---|---|---|---|---|
| 06/24/2025 06/24/25 | For Rent | $2,650 | 0.0% | -- |
| 07/15/2024 07/15/24 | Sold | $285,000 | +10.7% | $318 / Sq Ft |
| 06/21/2024 06/21/24 | Sold | $257,500 | -13.9% | $255 / Sq Ft |
| 06/19/2024 06/19/24 | For Sale | $299,000 | +7.2% | $334 / Sq Ft |
| 06/18/2024 06/18/24 | Pending | -- | -- | -- |
| 04/23/2024 04/23/24 | For Sale | $279,000 | -21.8% | $277 / Sq Ft |
| 12/20/2023 12/20/23 | Sold | $357,000 | -3.3% | $277 / Sq Ft |
| 12/13/2023 12/13/23 | Pending | -- | -- | -- |
| 11/04/2023 11/04/23 | For Sale | $369,000 | 0.0% | $286 / Sq Ft |
| 10/08/2023 10/08/23 | Rented | $3,100 | 0.0% | -- |
| 07/14/2023 07/14/23 | Sold | $330,000 | -7.0% | $254 / Sq Ft |
| 07/12/2023 07/12/23 | Pending | -- | -- | -- |
| 06/12/2023 06/12/23 | For Sale | $354,900 | 0.0% | $273 / Sq Ft |
| 04/03/2023 04/03/23 | For Rent | $3,500 | 0.0% | -- |
| 01/01/2023 01/01/23 | Rented | $3,500 | 0.0% | -- |
| 10/28/2022 10/28/22 | Sold | $310,000 | 0.0% | $240 / Sq Ft |
| 10/23/2022 10/23/22 | For Rent | $3,500 | 0.0% | -- |
| 10/23/2022 10/23/22 | Off Market | $3,500 | -- | -- |
| 10/14/2022 10/14/22 | Pending | -- | -- | -- |
| 10/04/2022 10/04/22 | For Rent | $3,500 | 0.0% | -- |
| 10/04/2022 10/04/22 | For Rent | $3,500 | 0.0% | -- |
| 09/19/2022 09/19/22 | Rented | $3,500 | 0.0% | -- |
| 09/03/2022 09/03/22 | Off Market | $3,500 | -- | -- |
| 08/18/2022 08/18/22 | Price Changed | $329,000 | -3.2% | $255 / Sq Ft |
| 07/22/2022 07/22/22 | For Sale | $340,000 | 0.0% | $264 / Sq Ft |
| 07/06/2022 07/06/22 | Rented | $3,600 | +2.9% | -- |
| 06/22/2022 06/22/22 | For Rent | $3,500 | 0.0% | -- |
| 06/06/2022 06/06/22 | Sold | $205,000 | -40.6% | $229 / Sq Ft |
| 05/25/2022 05/25/22 | Pending | -- | -- | -- |
| 05/24/2022 05/24/22 | Sold | $345,200 | 0.0% | $268 / Sq Ft |
| 05/21/2022 05/21/22 | Off Market | $3,600 | -- | -- |
| 05/18/2022 05/18/22 | Pending | -- | -- | -- |
| 05/09/2022 05/09/22 | For Rent | $3,600 | 0.0% | -- |
| 05/04/2022 05/04/22 | Off Market | $3,600 | -- | -- |
| 05/03/2022 05/03/22 | For Rent | $3,600 | 0.0% | -- |
| 03/31/2022 03/31/22 | For Sale | $349,900 | +66.6% | $271 / Sq Ft |
| 11/14/2021 11/14/21 | For Sale | $210,000 | -24.5% | $234 / Sq Ft |
| 09/10/2019 09/10/19 | Sold | $278,000 | -0.7% | $214 / Sq Ft |
| 05/07/2019 05/07/19 | Price Changed | $280,000 | -6.4% | $215 / Sq Ft |
| 10/15/2018 10/15/18 | Price Changed | $299,000 | +24.6% | $230 / Sq Ft |
| 07/25/2018 07/25/18 | Sold | $240,000 | -7.7% | $238 / Sq Ft |
| 07/13/2018 07/13/18 | Pending | -- | -- | -- |
| 07/09/2018 07/09/18 | Price Changed | $259,900 | -1.9% | $258 / Sq Ft |
| 04/06/2018 04/06/18 | Price Changed | $264,900 | -15.9% | $263 / Sq Ft |
| 03/20/2018 03/20/18 | For Sale | $315,000 | +16.7% | $242 / Sq Ft |
| 11/21/2017 11/21/17 | For Sale | $269,900 | -11.5% | $267 / Sq Ft |
| 05/15/2017 05/15/17 | Sold | $305,000 | +29.8% | $235 / Sq Ft |
| 05/04/2017 05/04/17 | Pending | -- | -- | -- |
| 12/09/2016 12/09/16 | Sold | $235,000 | -30.7% | $182 / Sq Ft |
| 12/02/2016 12/02/16 | For Sale | $339,000 | +21.1% | $261 / Sq Ft |
| 12/01/2016 12/01/16 | Pending | -- | -- | -- |
| 11/18/2016 11/18/16 | Sold | $280,000 | -11.1% | $215 / Sq Ft |
| 11/08/2016 11/08/16 | Pending | -- | -- | -- |
| 03/18/2016 03/18/16 | For Sale | $315,000 | +5.0% | $242 / Sq Ft |
| 10/30/2015 10/30/15 | Sold | $300,000 | +13536.4% | $231 / Sq Ft |
| 10/23/2015 10/23/15 | Pending | -- | -- | -- |
| 09/11/2015 09/11/15 | Rented | $2,200 | -99.2% | -- |
| 09/06/2015 09/06/15 | Under Contract | -- | -- | -- |
| 08/04/2015 08/04/15 | Sold | $265,000 | +11945.5% | $206 / Sq Ft |
| 07/04/2015 07/04/15 | Pending | -- | -- | -- |
| 07/01/2015 07/01/15 | For Rent | $2,200 | 0.0% | -- |
| 07/01/2015 07/01/15 | For Sale | $325,000 | +29.5% | $250 / Sq Ft |
| 06/22/2015 06/22/15 | Sold | $251,000 | -10.0% | $195 / Sq Ft |
| 05/11/2015 05/11/15 | Pending | -- | -- | -- |
| 04/16/2015 04/16/15 | For Sale | $279,000 | +11.4% | $216 / Sq Ft |
| 04/03/2015 04/03/15 | Sold | $250,500 | +2.2% | $194 / Sq Ft |
| 04/02/2015 04/02/15 | Pending | -- | -- | -- |
| 01/23/2015 01/23/15 | Sold | $245,000 | -15.2% | $188 / Sq Ft |
| 01/22/2015 01/22/15 | Pending | -- | -- | -- |
| 01/14/2015 01/14/15 | For Sale | $289,000 | 0.0% | $224 / Sq Ft |
| 12/30/2014 12/30/14 | Rented | $2,600 | -99.0% | -- |
| 12/30/2014 12/30/14 | Under Contract | -- | -- | -- |
| 12/17/2014 12/17/14 | For Sale | $250,000 | 0.0% | $192 / Sq Ft |
| 12/04/2014 12/04/14 | For Rent | $2,600 | 0.0% | -- |
| 05/22/2014 05/22/14 | For Sale | $289,900 | 0.0% | $225 / Sq Ft |
| 04/17/2014 04/17/14 | Rented | $2,200 | +10.6% | -- |
| 04/16/2014 04/16/14 | Under Contract | -- | -- | -- |
| 02/17/2014 02/17/14 | For Rent | $1,990 | 0.0% | -- |
| 10/11/2013 10/11/13 | Sold | $395,000 | -4.8% | $224 / Sq Ft |
| 10/10/2013 10/10/13 | Pending | -- | -- | -- |
| 05/14/2013 05/14/13 | For Sale | $415,000 | +196.4% | $236 / Sq Ft |
| 03/23/2012 03/23/12 | Sold | $140,000 | 0.0% | $139 / Sq Ft |
| 03/23/2012 03/23/12 | Pending | -- | -- | -- |
| 03/23/2012 03/23/12 | For Sale | $140,000 | -- | $139 / Sq Ft |
| Year | Tax Paid | Tax Assessment Tax Assessment Total Assessment is a certain percentage of the fair market value that is determined by local assessors to be the total taxable value of land and additions on the property. | Land | Improvement |
|---|---|---|---|---|
| 2024 | $14,055 | $737,820 | -- | $737,820 |
| 2023 | $13,719 | $717,450 | $0 | $717,450 |
| 2022 | $12,938 | $697,080 | $0 | $697,080 |
| 2021 | $13,061 | $689,498 | $0 | $0 |
| 2020 | $12,691 | $679,978 | $0 | $0 |
| 2019 | $12,518 | $664,690 | $0 | $0 |
| 2018 | $12,380 | $652,296 | $0 | $0 |
| 2017 | $12,250 | $638,880 | $0 | $0 |
| 2016 | $11,160 | $609,780 | $0 | $0 |
| 2015 | $9,457 | $551,580 | $0 | $0 |
| 2014 | $9,457 | $521,535 | $0 | $0 |
Seller's Agent in 2025
Courtney Roberts
Roberts & Co. Real Estate Svcs
(850) 251-6975
61 Total Sales
D
Seller's Agent in 2024
Dana Baus
Signature Realty Professionals
(850) 339-1008
39 in this area
51 Total Sales
Seller's Agent in 2024
Dana Salley
J. D. Salley & Associates, Inc
(850) 545-1217
19 in this area
66 Total Sales
Buyer's Agent in 2024
Carla Stephens
Hill Spooner & Elliott Inc
(850) 544-0207
1 in this area
34 Total Sales
Buyer's Agent in 2024
Angela Hope Gaines
Keller Williams Town & Country
(850) 322-2897
1 in this area
130 Total Sales
Seller's Agent in 2023
Michael Carruthers
Joseph R. Bracciale Jr. Broker
(850) 545-6468
2 in this area
90 Total Sales
Source: Capital Area Technology & REALTOR® Services (Tallahassee Board of REALTORS®)
MLS Number: 291384
APN: 21-36-41-000-005.0
Disclaimer: Certain information contained herein is derived from information provided by parties other than Homes.com. All information provided is deemed reliable, but is not guaranteed to be accurate and should be independently verified.
![]() IDX information is provided exclusively for personal, non-commercial use, and may not be used for any purpose other than to identify prospective properties consumers may be interested in purchasing.
IDX information is provided exclusively for personal, non-commercial use, and may not be used for any purpose other than to identify prospective properties consumers may be interested in purchasing.
Information is deemed reliable but not guaranteed.