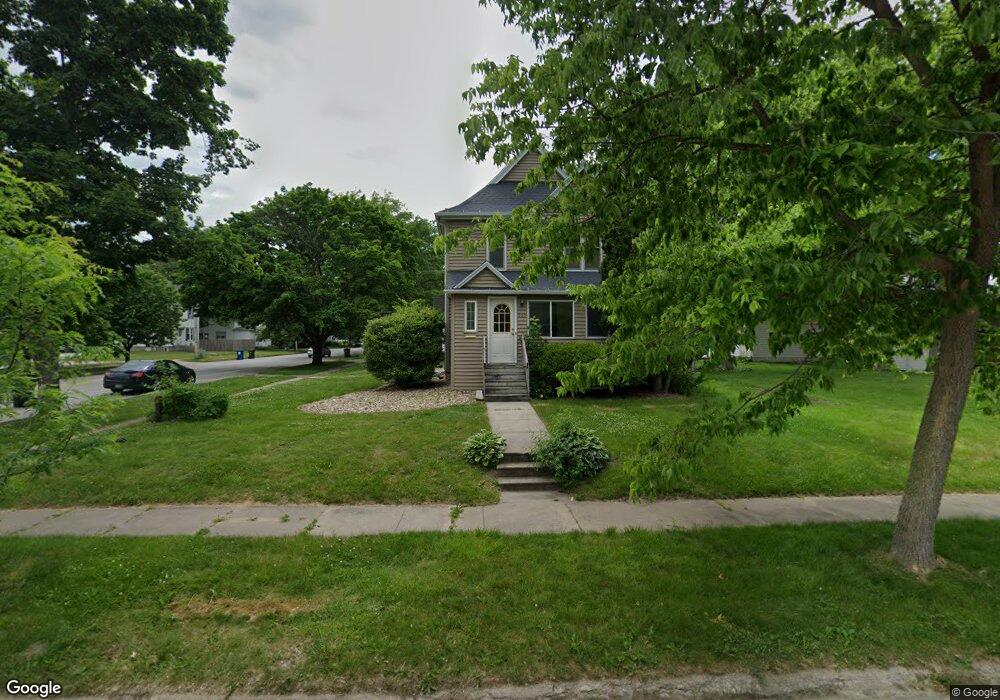
121 Walnut St Cedar Falls, IA 50613
Estimated Value: $170,000 - $205,000
4
Beds
1
Bath
1,342
Sq Ft
$136/Sq Ft
Est. Value
About This Home
This home is located at 121 Walnut St, Cedar Falls, IA 50613 and is currently estimated at $182,220, approximately $135 per square foot. 121 Walnut St is a home located in Black Hawk County with nearby schools including Lincoln Elementary School, Holmes Junior High School, and Cedar Falls High School.
Ownership History
Date
Name
Owned For
Owner Type
Purchase Details
Closed on
May 9, 2014
Sold by
Tripolino Christopher S and Tripolino Erin J
Bought by
Joshua 24:15 Properties Llc
Current Estimated Value
Home Financials for this Owner
Home Financials are based on the most recent Mortgage that was taken out on this home.
Original Mortgage
$102,800
Outstanding Balance
$78,147
Interest Rate
4.34%
Mortgage Type
Future Advance Clause Open End Mortgage
Estimated Equity
$104,073
Purchase Details
Closed on
Aug 24, 2006
Sold by
Hawkenson Paulette L
Bought by
Tripolino Christopher S and Tripolino Erin J
Home Financials for this Owner
Home Financials are based on the most recent Mortgage that was taken out on this home.
Original Mortgage
$80,000
Interest Rate
6.78%
Mortgage Type
New Conventional
Create a Home Valuation Report for This Property
The Home Valuation Report is an in-depth analysis detailing your home's value as well as a comparison with similar homes in the area
Home Values in the Area
Average Home Value in this Area
Purchase History
| Date | Buyer | Sale Price | Title Company |
|---|---|---|---|
| Joshua 24:15 Properties Llc | $128,500 | None Available | |
| Tripolino Christopher S | $100,500 | Title Services Corporation |
Source: Public Records
Mortgage History
| Date | Status | Borrower | Loan Amount |
|---|---|---|---|
| Open | Joshua 24:15 Properties Llc | $102,800 | |
| Previous Owner | Tripolino Christopher S | $80,000 |
Source: Public Records
Tax History Compared to Growth
Tax History
| Year | Tax Paid | Tax Assessment Tax Assessment Total Assessment is a certain percentage of the fair market value that is determined by local assessors to be the total taxable value of land and additions on the property. | Land | Improvement |
|---|---|---|---|---|
| 2025 | $2,716 | $171,950 | $36,040 | $135,910 |
| 2024 | $2,716 | $154,160 | $23,170 | $130,990 |
| 2023 | $2,318 | $154,160 | $23,170 | $130,990 |
| 2022 | $2,346 | $125,560 | $23,170 | $102,390 |
| 2021 | $2,218 | $125,560 | $23,170 | $102,390 |
| 2020 | $2,174 | $119,120 | $16,730 | $102,390 |
| 2019 | $2,174 | $119,120 | $16,730 | $102,390 |
| 2018 | $2,202 | $119,120 | $16,730 | $102,390 |
| 2017 | $2,258 | $119,120 | $16,730 | $102,390 |
| 2016 | $2,114 | $119,590 | $16,730 | $102,860 |
| 2015 | $2,114 | $119,590 | $16,730 | $102,860 |
| 2014 | $2,054 | $114,920 | $16,730 | $98,190 |
Source: Public Records
Map
Nearby Homes
- 711 W 2nd St
- 109 Walnut St
- 122 Walnut St
- 209 Walnut St Unit 2
- 209 Walnut St Unit 1
- 209 Walnut St Unit 3-6
- 209 Walnut St
- 723 W 2nd St
- 118 Walnut St
- 116 Olive St
- 615 W 2nd St
- 211 Walnut St
- 110 Walnut St
- 110 Olive St
- 209 & 211 Walnut St
- 622 W 2nd St
- 622 W 1st St
- 202 Olive St
- 714 W 1st St
- 213 Walnut St Unit 215